
 Help
Help S&P 500 under pressure amid trade, geopolitical and AI investment concerns
The S&P 500 faces downward pressure driven by incoming US tariffs, escalating Middle East conflicts driving oil prices higher, and tech earnings disappointments surrounding AI spending, despite maintaining long-term technical strength.
Potential US tariffs targeting 60 trading partners trigger broad commercial and economic market anxiety.
Middle East escalation pushes oil past $100 per barrel, raising inflation risks and the odds of interest rate hikes.
Tesla's earnings miss and Alphabet's AI scrutiny drag down tech stock performance and broader market sentiment.
Date: 23 July 2026
S&P 500 retreats amid mounting concerns over trade, geopolitics, and AI investments
The S&P 500 futures contract (ESU6) came under pressure due to a combination of commercial, geopolitical, and financial headwinds. According to data from CNBC, the Trump administration is set to impose new tariffs after midnight on Friday targeting 60 trading partners, citing alleged forced-labour violations. Concurrently, Reuters reports that these new tariffs will range between 10% and 12.5%, coming just as a temporary 10% global tariff expires.
Furthermore, ongoing tensions between the US and Iran in the Middle East have escalated following the direct involvement of the Houthi group, raising renewed concerns that disruptions in the Bab el-Mandeb Strait could accelerate global energy supply shocks. In this context, major crude oil benchmarks surged in tandem. The Brent crude futures contract (BRNU6) advanced by 7.04% to $100.69 per barrel amid rising geopolitical risks. Similarly, the West Texas Intermediate (WTI) futures contract (CLU6) increased by 6.18% to $92.19 per barrel.
Consequently, the CME FedWatch Tool indicated an increase in the implied probability of a September interest rate hike, while the 10-year US Treasury yield advanced to 4.7%—a level not observed since January 2025.
In corporate developments, Tesla led the decline among equities, with shares in the automotive giant falling by 14.52% to $319.69 after the firm failed to meet Wall Street’s earnings per share (EPS) expectations. At yesterday's market close, Tesla reported total quarterly revenue of $28.24 billion, exceeding forecasts of $25.55 billion; however, EPS came in at $0.33, missing the consensus estimate of $0.49. Meanwhile, despite Alphabet exceeding analysts' estimates on both revenue and EPS, its shares dropped 7.13% to $317.69 amid intense market scrutiny over its AI investment expenditure.
At the market close, the S&P 500 futures contract declined by 1.23% to 7,444 points, breaking below a key technical triangle structure.
Technical analysis of the S&P 500 index
From a technical perspective, the S&P 500 continues to sustain its primary long-term bullish trajectory. Key structural observations include:
- Trend Context: Over the long term, the S&P 500 maintains a robust market structure defined by a sequence of higher highs and higher lows, trading comfortably above its 100- and 200-day Simple Moving Averages (SMAs). In the short term, however, momentum indicators—most notably the MACD and RSI—are trending downwards, while a triangle technical pattern is breaking to the downside.
- Resistance Levels: Should the index recover its bullish momentum, the primary technical ceiling is located at 7,625 points (the record high). A sustained move above this level would open the door to further expansion into uncharted territory, being a prominent technical ceiling the 8,000 psychological threshold.
- Support Levels: In the event of a deeper market retracement, immediate support sits at 7,250 points, which converges with the 100-day SMA. A breach of this level would significantly increase the probability of a broader correction towards the 7,000 psychological floor, where the 200-day SMA currently lies.
- Momentum Indicators: Both the Moving Average Convergence Divergence (MACD) and the Relative Strength Index (RSI) are exhibiting a downward trajectory, suggesting that short-term bearish momentum could intensify. Nevertheless, macroeconomic and fundamental drivers are likely to remain the primary determinants of the index's direction over the coming sessions.
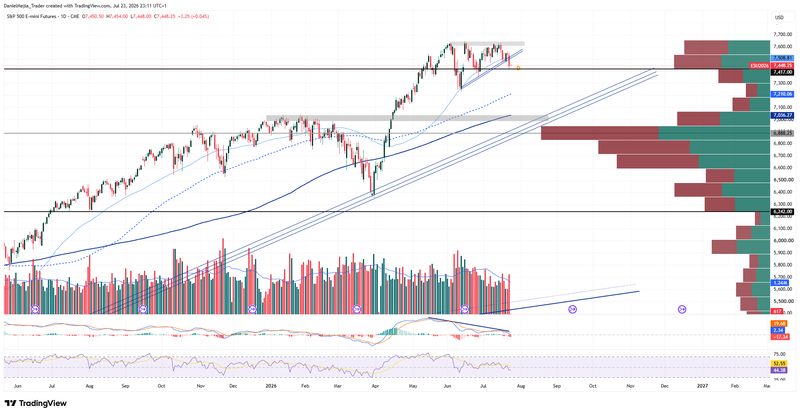
Figure 1. S&P 500 Index (2025–2026). Source: Data from the CME Group; Own analysis conducted via TradingView.


