
 Help
Help UK GDP growth slows in Q2 2026; GBP/USD edges lower
UK GDP growth slowed to 0.4% in Q2 2026, revealing underlying economic resilience despite the implied deceleration.
UK Q2 2026 GDP expansion moderated to 0.4% from 0.6%, fully matching market expectations.
Bank of England rate expectations remain steady at 3.75%, though a potential rate hike remains on the table for late 2026.
Following the release, the British pound dipped 0.05% against the US dollar, trading near $1.3486.
Date: 13 August 2026
UK GDP expansion loses momentum in Q2 2026; Sterling dips against the dollar
Data released by the Office for National Statistics (ONS) reveals that the UK Gross Domestic Product (GDP) growth rate decelerated from 0.6% in Q1 to 0.4% in Q2 2026, matching analysts' expectations. Breakdown data from Trading Economics indicates that gross fixed capital formation increased by 1.2%, while household consumption advanced by 0.3%. Conversely, government consumption contracted by 0.3%. On an annual basis, the GDP growth rate eased from 1.2% to 1.1%.
Following the GDP release, the British pound fell marginally by 0.05% against the US dollar to trade near $1.3486. Although the UK economy exhibited a slight deceleration, it continues to demonstrate fundamental resilience—underpinned by sustained economic expansion, easing inflation (which eased to 2.6% in June), and unemployment rate that has gradually declined over four months (reaching 4.9% in May). Concurrently, significant uncertainty surrounding the Federal Reserve's upcoming monetary policy decisions continues to generate ongoing volatility in US dollar performance.
In this context, market expectations regarding future monetary policy decisions by the Bank of England reflect a likely steadying of interest rates at 3.75%, though analysts’ expectations suggest the UK central bank could implement a final interest rate hike towards the end of 2026.
Additionally, market participants are closely monitoring the ongoing US-Iran conflict in the Middle East; any prolonged persistence of this friction poses a threat of energy supply disruptions, which risks exacerbating global inflationary pressures should bilateral hostilities endure.
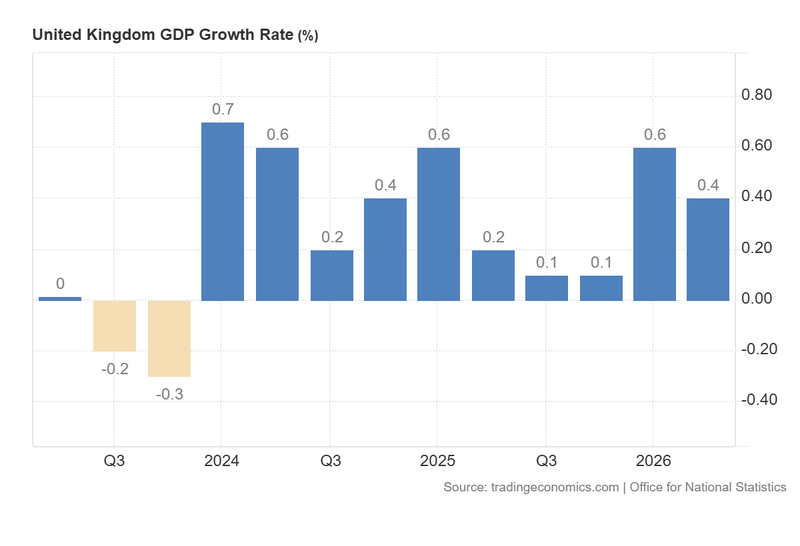
Figure 1. United Kingdom GDP Growth Rate (2023–2026). Source: Data from the UK Office for National Statistics; figure obtained from Trading Economics.
Technical analysis of the GBP/USD pair
From a technical perspective, the GBP/USD pair continues to trade within the boundaries of a long-term bullish channel. However, the immediate market structure indicates a consolidation phase performance:
- Trend Context: While the pair maintains a long-term bullish trajectory defined by a sequence of higher highs and higher lows, it is currently oscillating inside a consolidation range pattern. Notably, the GBP/USD pair is trading near the Volume Profile’s Point of Control (POC), reinforcing the technical range pattern.
- Resistance Levels: Should the short-term resistance zone near $1.3540 be cleared to the upside, the next critical resistance level lies at $1.3650, which marks a long-term structural ceiling. A decisive daily close above this threshold would signal a formal resumption of the primary bullish trend and open the path towards higher price territory.
- Support Levels: If selling pressure gains momentum, the next critical demand floors are identified at $1.3300 and $1.3180. The latter level represents a key confluence zone between short-term structural support and the lower boundary of the broader bullish channel. A breach of the $1.3180 zone would significantly heighten the probability of a deeper market correction.
- Momentum Indicators: Both the Moving Average Convergence Divergence (MACD) and the Relative Strength Index (RSI) display an upward trajectory, suggesting that underlying bullish momentum could continue. However, the broader behaviour of both indicators remains erratic, aligning with the current lack of a clear directional bias.
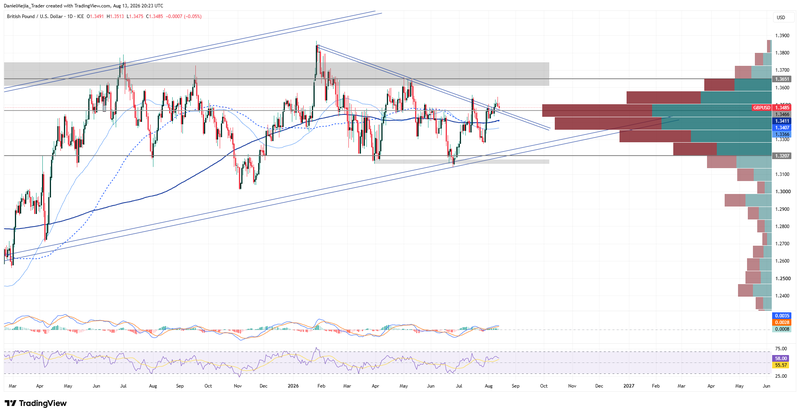
Figure 2. GBP/USD pair (2025–2026). Source: Data from the Intercontinental Exchange (ICE); own analysis conducted via TradingView.


