
 Help
Help UK industrial activity strengthens beyond expectations; GBP/USD climbs
Strong UK industrial production figures surpassed forecasts, boosting GBP/USD to $1.3520. However, persistent inflation and mixed economic indicators highlight uncertainty surrounding future Bank of England monetary policy decisions.
UK industrial production expanded by 0.6% year-on-year (YoY) in July, comfortably exceeding expectations of 0.2% growth.
GBP/USD rose by 0.10% to $1.3520, supported by solid UK macroeconomic data and steady US inflation at 3.4%.
The Bank of England faces complex policy trade-offs amid 2.9% inflation and moderating GDP growth of 0.4%.
Date: 11 September 2026
Can strong UK industrial production sustain the pound's rally?
According to data released by the United Kingdom's Office for National Statistics (ONS), industrial production accelerated from –0.2% in June to 0.6% year-on-year (YoY) in July, exceeding analysts' consensus forecasts of 0.2%. Data compiled by Trading Economics indicates that this output improvement was driven primarily by the manufacture of computer, electronic, and optical products, where production rose by 3.9%. Additionally, water supply, sewerage, and waste management advanced by 2.0%. Conversely, output in mining and quarrying, alongside electricity, gas, steam, and air conditioning, experienced contractions.
This industrial production release arrives against the backdrop of a subdued macroeconomic environment, characterised by an annual inflation rate of 2.9% (remaining above the central bank's target), an unemployment rate of 4.9% (above its three-year average), and gross domestic product (GDP) growth of 0.4%, which points to moderate economic expansion.
Against this backdrop, it remains uncertain whether the Bank of England (BoE) will raise its benchmark interest rate at upcoming policy meetings. Although inflation remains elevated, its decelerating trajectory over the past year could justify the central bank maintaining a neutral stance in an effort to support broader economic activity.
Following the economic release, the British pound appreciated against the US dollar, buoyed by the robust UK industrial data and a neutral US inflation rate that held steady at 3.4%. Consequently, the GBP/USD currency pair advanced by 0.10% to close at $1.3520.
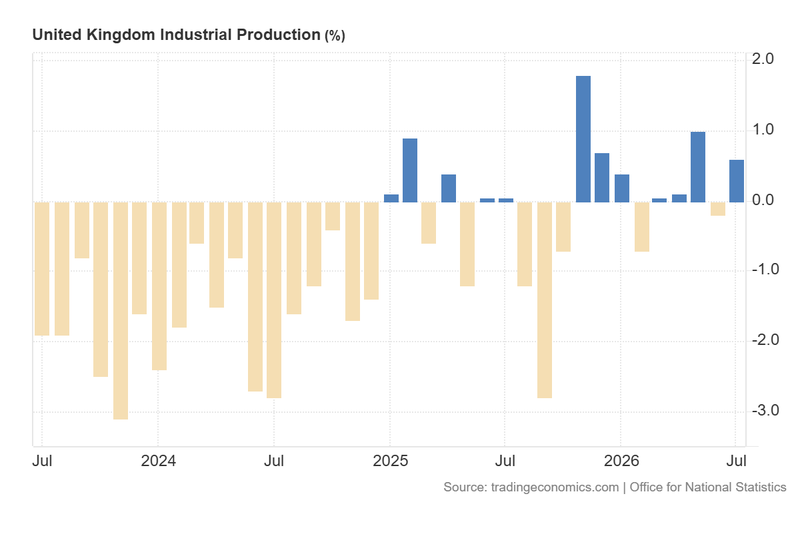
Figure 1. United Kingdom Industrial Production (2023–2026). Source: Data from the UK Office for National Statistics; figure obtained from Trading Economics.
Technical analysis of the GBP/USD pair
From a technical perspective, the GBP/USD pair continues to trade within a long-term bullish channel. However, the immediate market structure reflects a period of consolidation:
- Trend Context: Although the pair maintains a long-term bullish trajectory defined by a sequence of higher highs and higher lows, it is currently oscillating within a consolidation range. Notably, GBP/USD continues to exhibit a positive short-term structure, trading above its 50-day, 100-day, and 200-day Simple Moving Averages (SMAs), reinforcing the prevailing bullish bias.
- Resistance Levels: Should the short-term resistance zone near $1.3660 be cleared to the upside, the next critical resistance level lies at $1.3850, marking a long-term structural ceiling. A decisive daily close above this threshold would signal a formal resumption of the primary bullish trend, opening the probability towards higher price territory.
- Support Levels: In the event of a market retracement, key demand floors are located at $1.3480 and $1.3450 (where the 50-day, 100-day, and 200-day SMAs converge). A breach below these levels would heighten the probability of a deeper market correction.
- Momentum Indicators: In contrast to the bullish price action structure, both the Moving Average Convergence Divergence (MACD) and the Relative Strength Index (RSI) display downward trajectories, suggesting that a short-term retracement or consolidation phase may ensue. Nevertheless, macroeconomic and geopolitical factors are expected to remain the primary drivers of future price direction.
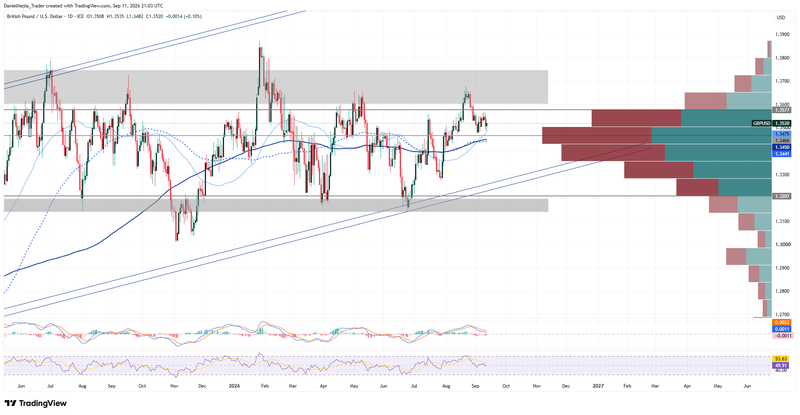
Figure 2. GBP/USD Pair (2025–2026). Source: Data from the Intercontinental Exchange (ICE); author's analysis conducted via TradingView.


