Help
Help UK retail sales slow sharply, but GBP/USD moves higher
The GBP/USD currency pair advanced despite disappointing UK retail sales data, supported primarily by broad-based weakness in the US dollar tied to domestic debt concerns.
UK retail sales slowed sharply year-on-year (YoY) from 3.8% in June to 1.6% in July, missing market forecasts.
Adverse weather and reduced consumer promotional activity weighed heavily on UK non-food sales volumes.
Subdued demand for the greenback lifted GBP/USD by 0.11% to $1.3644, overriding the weak UK economic release.
Date: 21 August 2026
GBP/USD advances despite sharp deceleration in UK retail sales
According to data from the UK Office for National Statistics (ONS), year-on-year (YoY) retail sales decelerated sharply from 3.8% in June to 1.6% in July, missing analysts' forecasts of 2.2%. On a monthly basis, retail sales fell by 0.5%. Analysis from Trading Economics suggests that non-food store sales volumes declined by 1.3%, driven by weaker sales of clothing and household goods. Adverse weather conditions and reduced promotional activity diminished underlying consumer demand.
However, following the release, the British pound appreciated against the US dollar amid escalating concerns over US sovereign debt, which weighed on the greenback. The GBP/USD pair advanced by 0.11% to $1.3644 as it sought to clear a key technical resistance level.
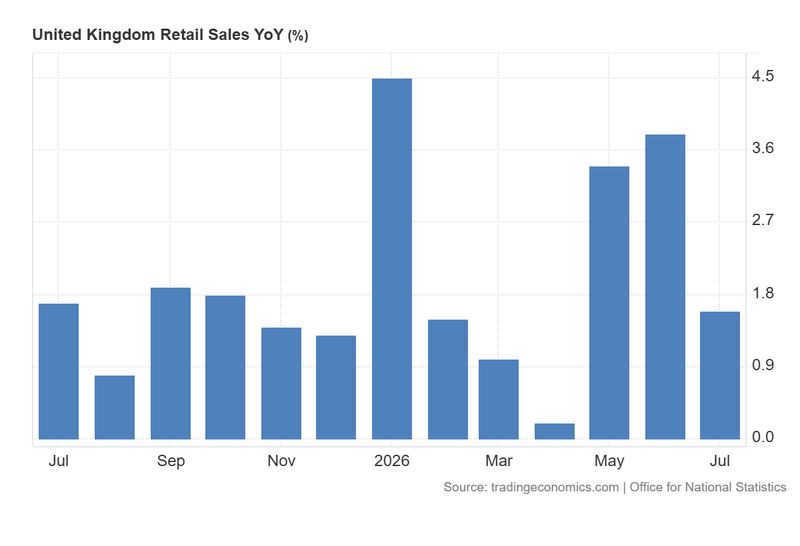
Figure 1. United Kingdom Retail Sales (2025–2026). Source: Data from the UK Office for National Statistics; figure obtained from Trading Economics.
Technical analysis of the GBP/USD pair
From a technical perspective, the GBP/USD pair continues to trade within a long-term bullish channel. However, the immediate market structure reflects a phase of consolidation:
- Trend Context: Although the pair maintains a long-term bullish trajectory defined by a sequence of higher highs and higher lows, it is currently oscillating within a consolidation range. Notably, GBP/USD is attempting to clear the Volume Profile's Value Area High (VAH) level, signalling a strengthening bullish bias.
- Resistance Levels: Should the short-term resistance zone near $1.3644 be cleared to the upside, the next critical resistance level lies at $1.3850, marking a long-term structural ceiling. A decisive daily close above this threshold would signal a formal resumption of the primary bullish trend and open the path towards higher price territory.
- Support Levels: In the event of a market retracement, the next critical demand floors are located at $1.3541 and $1.3280. A breach below the $1.3280 zone would significantly heighten the probability of a deeper market correction.
- Momentum Indicators: Both the Moving Average Convergence Divergence (MACD) and the Relative Strength Index (RSI) display upward trajectories, suggesting that underlying bullish momentum could persist. However, both indicators are nearing overbought territory, reflecting caution regarding the sustainability of this momentum.
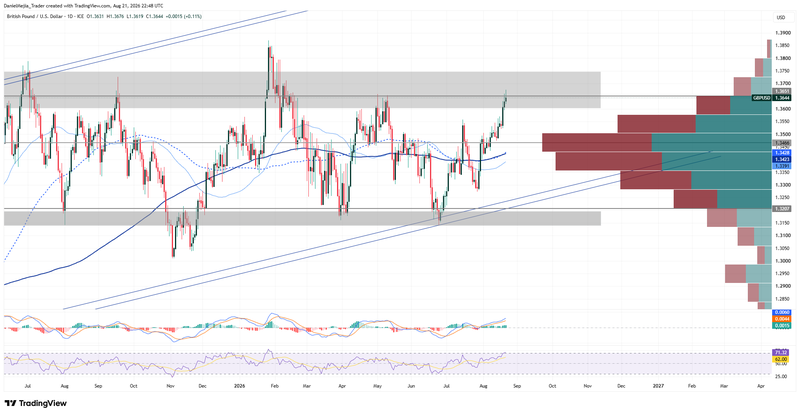
Figure 2. GBP/USD Pair (2025–2026). Source: Data from the Intercontinental Exchange (ICE); author's analysis conducted via TradingView.