Help
Yen advances amid accelerating inflation in Japan
The Japanese yen appreciated as Japan’s headline and core inflation rates both accelerated to 2.1% in September, intensifying fundamental economic pressure whilst the central bank balances rising price pressures against sluggish growth.

Headline inflation accelerated to 2.1% in September, reaching its highest level since December 2025.
Core inflation rose sharply from 1.7% to 2.1%, suggesting that elevated energy and transport costs may be feeding into the core figure.
The Bank of Japan aims to curb price surges to protect fragile economic growth, which has averaged 0.28% quarterly over the past two years.
The Japanese yen strengthened marginally against the US dollar following the release, reaching ¥156.82.
Date: 24 October 2026 (GMT+3)
Why is the Japanese yen strengthening as inflation accelerates?
According to data released by the Ministry of Internal Affairs and Communications of Japan, the headline inflation rate accelerated from 1.9% in August to 2.1% in September, marking its highest level since December 2025. This upward trend was reflected across several sectors, as government energy subsidies partially offset underlying increases in crude oil prices. Nevertheless, transport cost growth accelerated from 2.3% in August to 2.5% in September, whilst gas inflation advanced from 2.0% to 2.4%—as cited by Trading Economics.
Concurrently, the statistical authority reported that the core inflation rate—which excludes the volatile components of fresh food and energy—accelerated sharply from 1.7% to 2.1%, suggesting that energy cost pressures may have passed through into the broader core basket via higher fuel expenses.
Although current inflation remains close to the Bank of Japan’s (BoJ) 2.0% target, the central bank has repeatedly emphasised that it will not permit price pressures to rebound significantly. Such a resurgence could undermine economic growth expectations, which have already exhibited structural weaknesses. On average, quarterly gross domestic product (GDP) growth has expanded by just 0.28% (quarter-on-quarter) over the past two years.
Following the inflation release, the Japanese yen appreciated marginally against the US dollar by 0.04%, with the USD/JPY currency pair closing at ¥156.82. This performance may reflect rising expectations that the BoJ will adopt a more restrictive monetary policy stance if inflationary pressures persist.
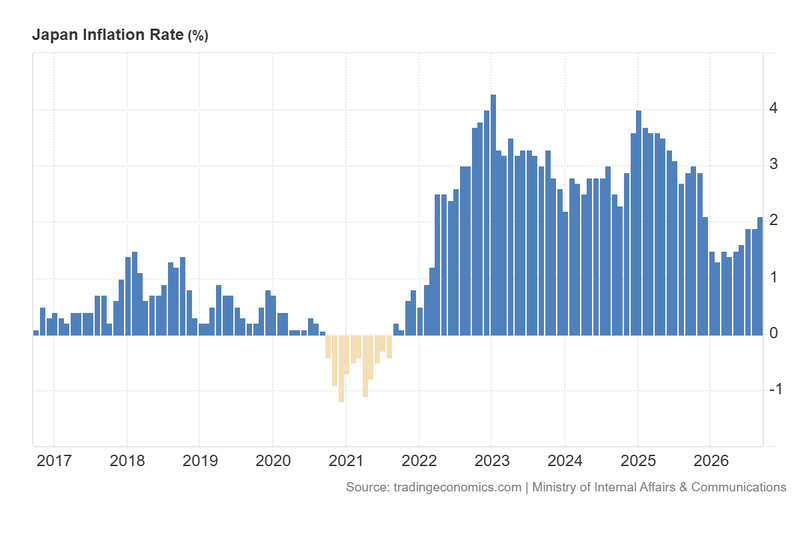
Figure 1. Japan Inflation Rate (2016–2026). Source: Data from the Ministry of Internal Affairs and Communications; chart retrieved from Trading Economics.
Technical analysis of the USD/JPY pair
From a technical perspective, the USD/JPY currency pair is currently undergoing a period of consolidation. Key observations include:
- Trend context: Over a longer-term horizon, the pair maintains a technically bullish market structure, characterised by higher highs and higher lows. In the short term, however, price action remains confined within a year-to-date (YTD) consolidation range. Furthermore, the pair is trading below its 50-day, 100-day, and 200-day Simple Moving Averages (SMAs), signalling that underlying selling pressure remains active.
- Momentum indicators: The Moving Average Convergence Divergence (MACD) indicator exhibits a bearish crossover as it approaches the zero line, suggesting that short-term downward momentum could intensify. Additionally, the Relative Strength Index (RSI) is trending downwards, reinforcing the likelihood of further short-term bearish pressure. Nonetheless, macroeconomic fundamentals remain the primary driver of the pair's broader trajectory.
- Resistance levels: Should short-term bullish momentum re-emerge, the immediate resistance level is positioned at ¥158.50, where the Volume Profile’s Point of Control (POC) converges with the 200-day SMA. Beyond this technical confluence, key overhead resistance is situated near ¥162.00.
- Support levels: If short-term selling pressure persists, immediate downside support is identified at ¥155.50—corresponding to the 38.2% Fibonacci retracement level of the preceding bullish impulse. Beneath this, secondary support lies at ¥153.00, marking a confluence between the 50% Fibonacci retracement level and key structural support.
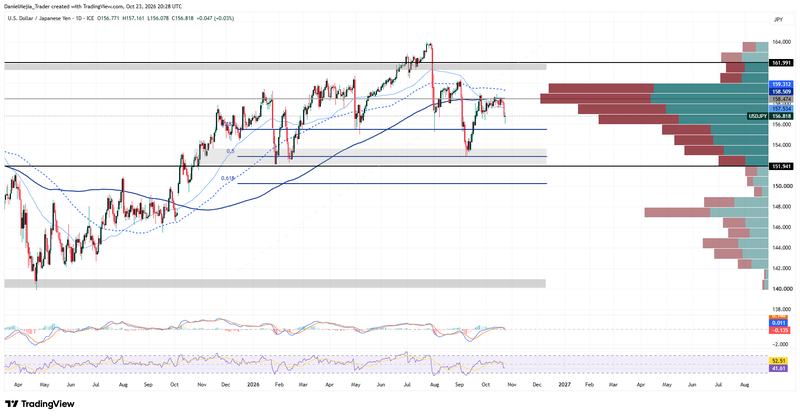
Figure 2. USD/JPY Pair (2025–2026). Source: Data from the Intercontinental Exchange (ICE); author's analysis conducted via TradingView.