Help
Daily bias in trading: how to identify market direction using liquidity
Daily bias in Inner Circle Trader (ICT) trading is a directional expectation bullish or bearish for the upcoming trading session based on higher-timeframe price structure and liquidity targets.
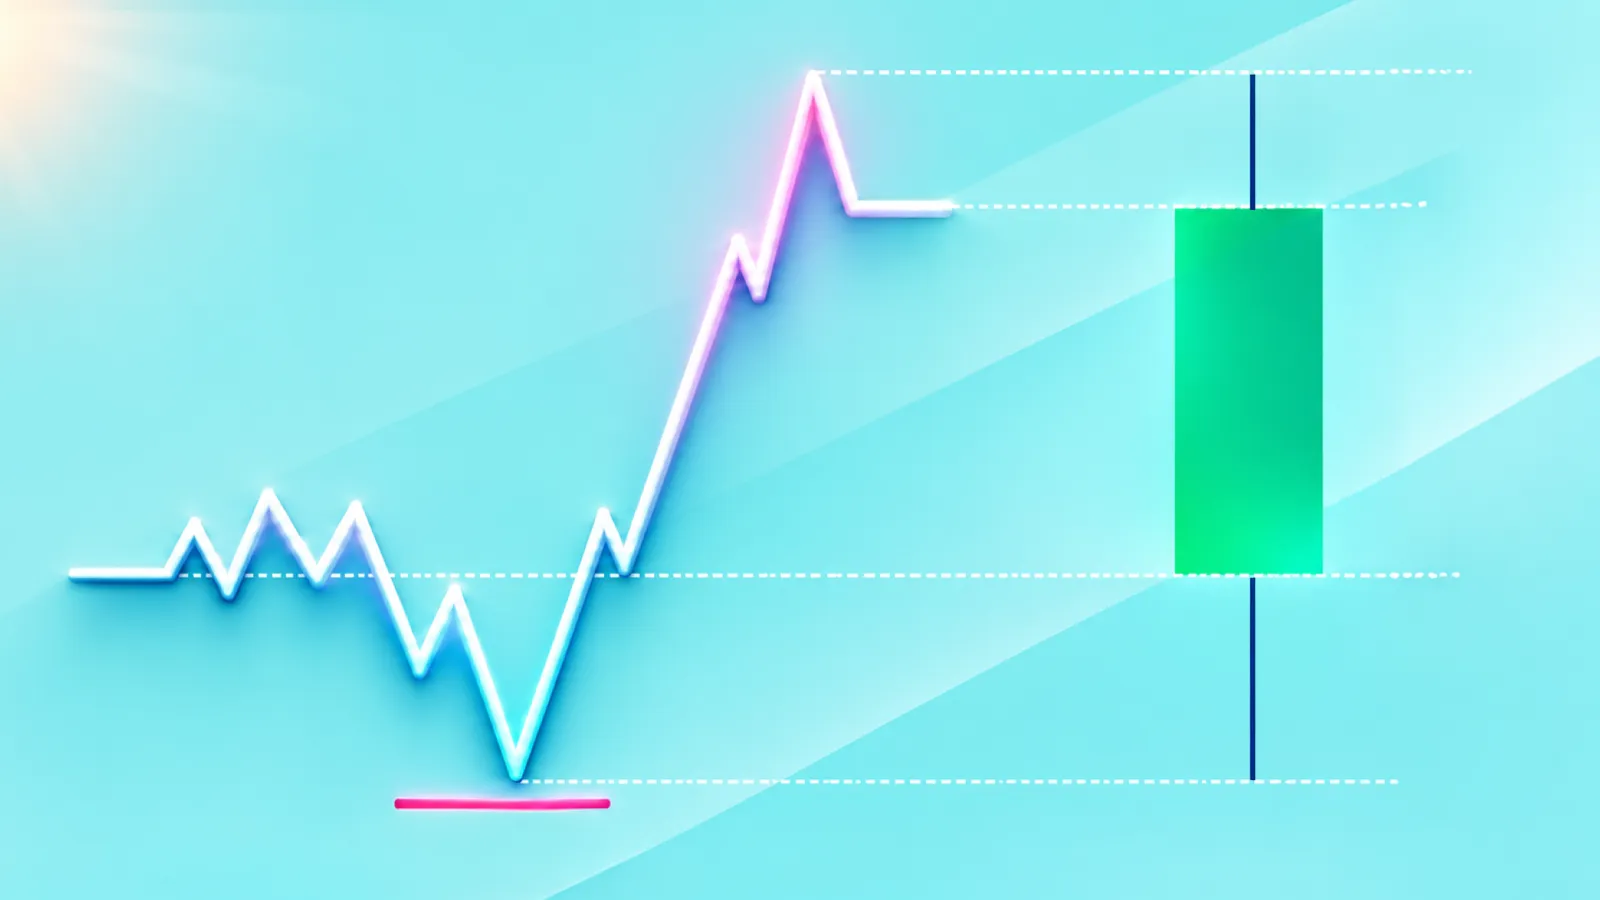
Daily bias is a directional expectation for the trading day, which can be bullish, bearish or neutral depending on market conditions.
Previous Day High (PDH), Previous Day Low (PDL) and weekly highs and lows are important liquidity levels that traders use to identify potential price targets.
Premium and discount zones help traders assess where price is trading within a range and whether buying or selling offers a more favourable entry.
Daily candle closes, liquidity sweeps and market structure can help traders distinguish between trend continuation and possible reversals.
What is daily bias in trading?
Daily bias is the direction a trader expects the market to move during the current trading day. It is usually determined by analyzing higher-timeframe price action and identifying which liquidity levels price may reach next.
A bullish daily bias means traders expect price to move higher, while a bearish bias means they expect price to move lower.
A neutral bias applies when there is no clear direction or when price is trading between important levels without showing signs of a breakout.
For example, if EUR/USD has been forming higher highs and higher lows on the daily chart, traders may have a bullish bias and look for opportunities to buy during intraday pullbacks.
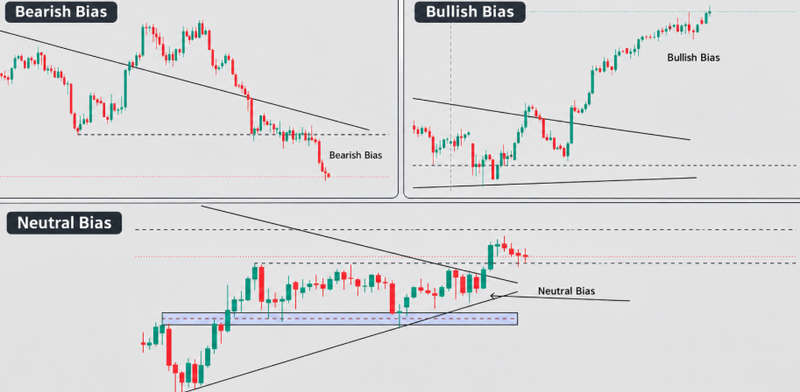
Source: Trading view
What is draw on liquidity?
Draw on liquidity (DOL) is the level at which the market is expected to trade next, these levels usually consist of previous swing highs and lows or levels of imbalance; traders evaluate liquidity above previous highs and below previous lows.
The term buy side liquidity refers to levels that exhibit the presence of stop-loss orders out of short positions and breakout buy orders above previous highs.
Sell-side liquidity resides below previous lows and may contain stop-loss orders out of long positions and sell-stop orders.
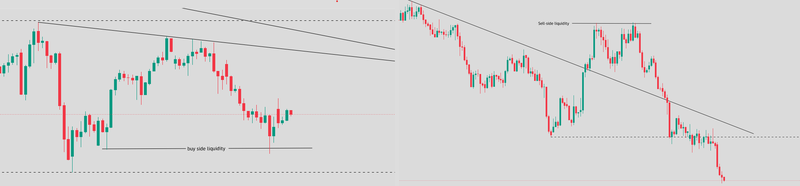
Source: Trading view
What is the difference between internal and external liquidity?
Internal liquidity consists of price areas where price is likely to find support and resistance within a defined trading range, these areas may include FVG and other price imbalances
External liquidity
encompasses price areas beyond the defined trading range, usually these are located above major swing highs and below swing lows.
If the EUR/USD is trading within the range of 1.0800 to 1.1000, and area of interest may be a bullish Fair Value Gap between 1.0850 and 1.0870.
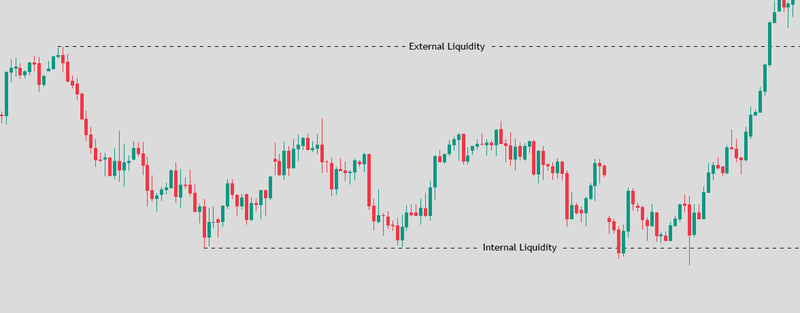
Source: Trading view
Why are previous day highs and lows important?
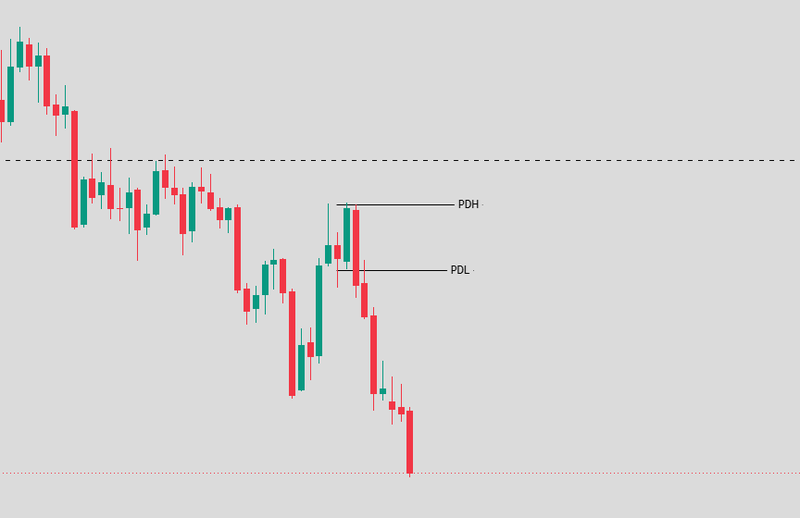
Previous Day High (PDH) and Previous Day Low (PDL) are levels used to identify liquidity and areas where price may reverse or continue in the same trend. These levels are marked prior to the start of the current trading session.
Previous day high (PDH)
The highest price reached during the previous trading session. It may represent a congested area of buy-stop orders. It may be an area of potential breakout and liquidity sweep.
Previous day low (PDL)
Previous Day Low is the lowest price of the day. Traders may expect to find sell-side liquidity below this level.
If the price breaks below 1.0800, but closes back above 1.0800, the expected breakdown didn’t happen, and the selling pressure is likely to dissipate. In this situation, reaching 1.0800 wasn’t important.
Source: Trading view
Previous week high and low (PWH/PWL)
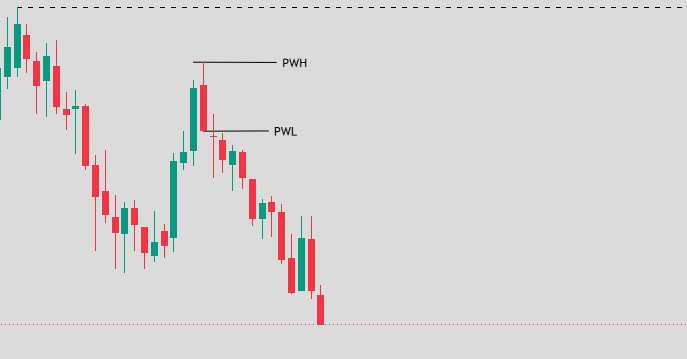
Previous week high (PWH) and previous week low (PWL) are highs and lows of the week.
If EUR/USD has broken above the previous day's high, then traders may look for the previous week’s high to be the next potential level of resistance.
Conversely, if the price breaks below the previous day's low, then the previous week's low may be support.
Source: Trading view
What are premium and discount zones?
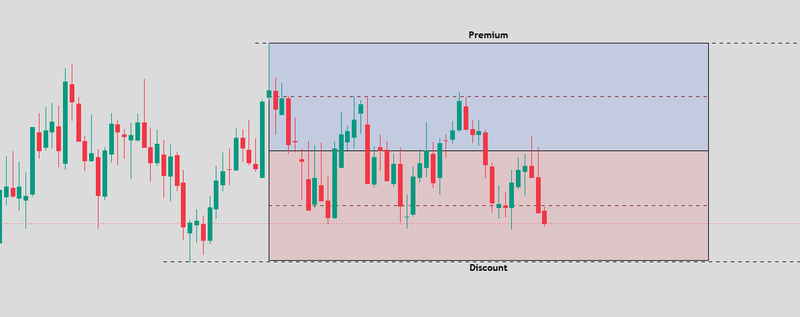
A trading range is divided into two halves by premium and discount zones, which help determine if a price is high or low within the range.
The midpoint, or the point of equilibrium, is found by adding the high and low of the range and then dividing the sum by two.
Equilibrium = (Range High + Range Low) ÷ 2
EUR/USD, for example, is in a range between 1.0800 and 1.1000. In this example, equilibrium is 1.0900.
The premium zone is the upper half of the range, from 1.0900 to 1.1000, and the discount zone is the lower half of the range, from 1.0800 to 1.0900.
Traders who believe the market will rise may prefer to buy in the discount zone, rather than near the range low. Conversely, traders with bearish bias may prefer selling in the premium zone.
Source: Trading view
How do traders identify daily bias using multiple timeframes?
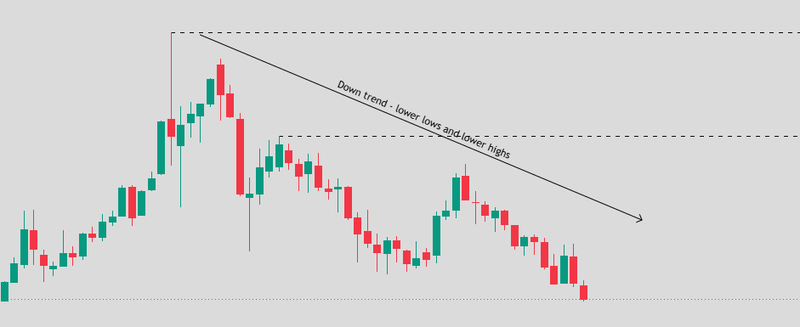
Weekly chart identify the trend Swing highs and lows refer to the most important highs and lows on a chart. The weekly chart shows traders where swing highs and lows occur and helps to define the direction and trend of the market.
Source: Trading view
Daily chart: identify the bias
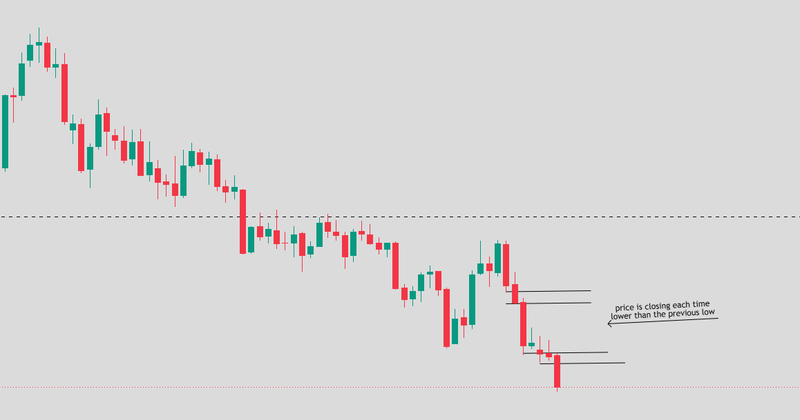
The daily chart defines direction for the trading day. The previous candle's closing price and its reaction to important liquidity areas, define the bias for the day.
A bullish bias may occur if the previous day's candle closed strongly above a previous swing high. If the high of the day was swept and the close was below it, a bearish bias may occur.
Source: Trading view
Four-hour chart: define levels of interest
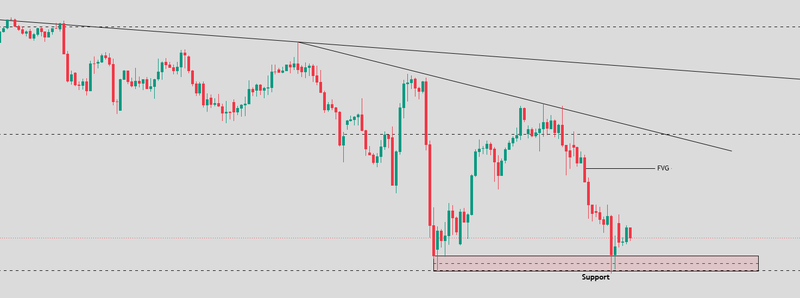
The four-hour chart allows traders to define Support and Resistance levels, Fair Value Gaps and other price structures, within the larger daily price trend.
One hour chart: look for confirmation
If a bullish bias has been defined, the one-hour chart may provide a confirmation in the form of a break and close above a recent swing high. This may indicate a bullish bias in the daily time frame. Higher time frames should be used for trade setup, and lower time frames for trade entry.
Source: Trading view
How can traders distinguish continuation from reversal?
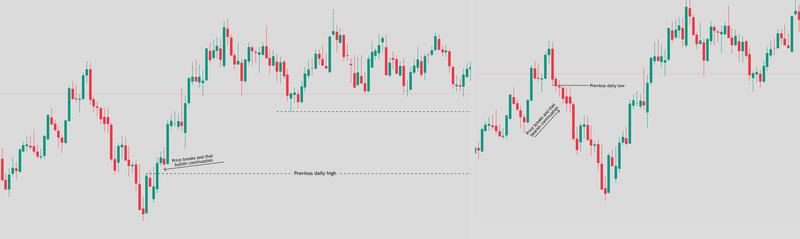
A continuation in a trend means that price breaks a significant level, and the trend continues. A potential reversal means that price breaks a significant level and continues to trade in the opposite direction.
Bullish and bearish continuation
If the EUR/USD was in an uptrend, and the previous day’s high was 1.0950, and price broke 1.0950 and closed at 1.0970, traders would expect the market to continue to the next swing high at 1.1000.
Source: Trading view
Reversal after a liquidity sweep
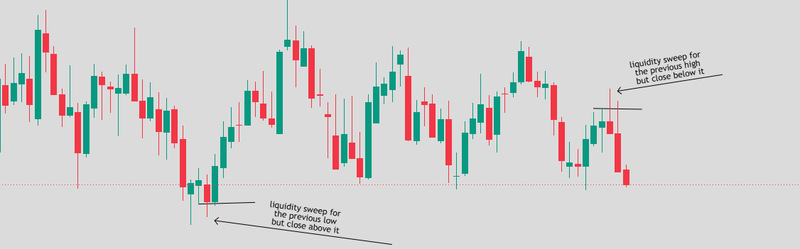
A liquidity sweep occurs when price moves out of a previous range and then returns into it. Let’s say Gold had a previous day’s high at 4,100, the price then moves up to 4,115 but then pulls back and closes at 4,100.
Traders may interpret this as a failed bullish breakout and begin to look for a move towards the previous day’s low.
The opposite happens when price sweeps a previous low and closes above it, a liquidity sweep does not always reverse and trade in the opposite side of the range.
Source: Trading view
What are the risks of trading with daily bias?
A bullish bias does not mean traders should buy every pullback. If price breaks important support and begins forming lower highs, the original expectation may no longer be valid.
Economic announcements can also change market direction quickly, particularly during interest rate decisions, inflation reports and employment data releases.
Traders should define the conditions that would invalidate their bias, use appropriate stop-loss levels and avoid forcing trades when the market does not offer a clear setup.
FAQs
What is daily bias in trading?
Daily bias is the direction a trader expects price to move during the current trading day, based on higher-timeframe market structure and liquidity levels.
How do I know if my daily bias is bullish or bearish?
Traders examine the weekly and daily trends, previous highs and lows, candle closes and nearby liquidity targets. A bullish bias favours higher prices, while a bearish bias favours lower prices.
What does DOL mean in trading?
DOL stands for Draw on Liquidity. It refers to a price level that traders expect the market to reach next, such as a previous swing high, swing low or an area of imbalance.
What are PDH and PDL?
PDH stands for Previous Day High, while PDL stands for Previous Day Low. Traders use these levels to identify potential liquidity targets, breakouts and reversals.
Can daily bias change during the trading day?
Yes. Daily bias can change if price breaks important market structure or reacts differently than expected around liquidity levels.