Help
Help Gas futures trading: a guide to natural gas markets
Trading natural gas futures requires an understanding of the technical aspects of derivative contracts—such as futures, options, and Contracts for Difference (CFDs)—alongside the price behaviour of key global benchmarks including Henry Hub, TTF, and JKM.

Natural gas trading operates predominantly through derivative instruments, facilitating price speculation without requiring physical asset acquisition.
The primary global benchmarks comprise Henry Hub (NYMEX) in the United States, Title Transfer Facility (TTF) in Europe, and the Japan Korea Marker (JKM) in Asia, which collectively lead regional pricing standards.
A thorough understanding of expiration dates, tick values, and Exchange-mandated margin requirements is essential for robust risk management.
Natural gas valuations are heavily influenced by seasonal climatic variations, structural shifts in feedstock supply and demand, and weekly inventory data releases.
What is natural gas futures trading?
Natural gas futures trading represents one of the most complex segments of the commodities market, primarily due to the distinct physical storage and distribution challenges inherent to this commodity. Because the valuation of natural gas is governed predominantly by fundamental supply and demand dynamics, weather events and seasonal shifts exert a pronounced influence on price action. Furthermore, macroeconomic conditions and evolving regulatory frameworks frequently alter the underlying supply-and-demand balance, driving market volatility.
The derivatives market in natural gas trading
Natural gas trading is primarily conducted via derivative contracts. A derivative is a financial instrument whose valuation is derived from the performance of an underlying asset, such as the spot market price of natural gas. Consequently, if the physical market price of natural gas appreciates over a given period, a corresponding futures contract linked to that underlying asset will typically exhibit near-identical directional movement.
Types of derivative contracts for natural gas trading
Natural gas trading focuses predominantly on capturing fluctuations in market value rather than taking physical delivery or arranging storage. These operational strategies are typically executed through three primary derivative instruments:
- Futures Contracts: Futures impose an obligation to buy or sell the underlying asset at a specified expiration date and at a predetermined price agreed upon at contract initiation. Futures contracts are widely used for both hedging and speculative purposes.
- Financial Options: Financial options confer the right, but not the obligation, to buy or sell the underlying asset in exchange for an upfront premium. These contracts specify an expiration date and strike price, allowing the holder to execute the transaction only if market movements prove advantageous relative to the agreed rate. Options are commonly used for hedging or speculation.
- Contracts for Difference (CFDs): CFDs are speculative instruments designed to capitalise on price movements of an underlying asset. If the price moves in favour of the open position, the trader realizes a profit; if the market moves adversely, a loss is incurred. Unlike futures or options, which may involve the physical delivery or exchange of the underlying commodity, CFDs are settled purely in cash based on price differentials.
Top natural gas futures benchmarks
Although several derivatives exchanges list natural gas futures globally, three key benchmarks dominate international trading volume and serve as regional pricing standards:
- Henry Hub: Listed on the New York Mercantile Exchange (NYMEX), the Henry Hub-pegged contract represents the primary benchmark for US domestic production and pricing.
- Title Transfer Facility (TTF): Traded on the Intercontinental Exchange (ICE), the TTF contract serves as the dominant benchmark for the European natural gas market.
- Japan Korea Marker (JKM): Also listed on ICE, the JKM is recognised as the primary pricing reference for Liquefied Natural Gas (LNG) delivered into Asian markets.
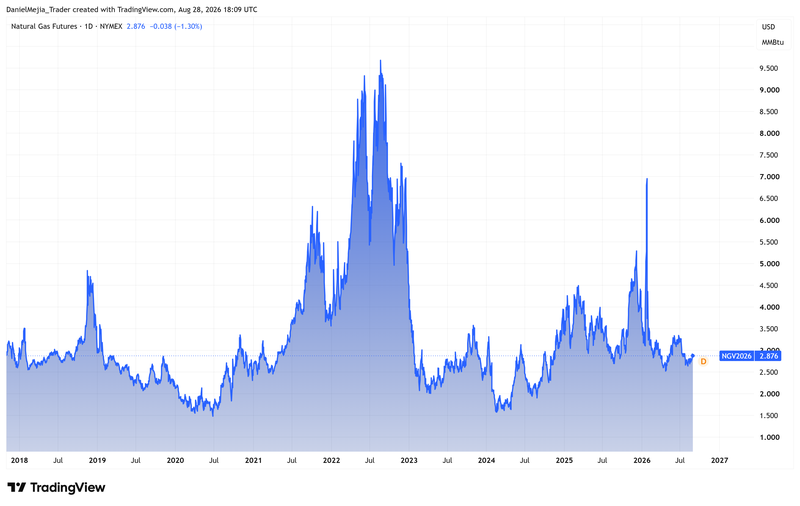
Figure 1. Natural Gas Futures (2018–2026). Source: Data from the NYMEX Exchange; Figure obtained from TradingView.
Futures contract architecture in natural gas trading
To trade natural gas effectively, market participants must look beyond supply-and-demand fundamentals and master the structural mechanics of the underlying futures contracts. Understanding these technical parameters is vital for implementing sound risk and capital management frameworks.
How to read a natural gas futures contract
Navigating trading operations requires an accurate reading of contract nomenclature. For example, in the NYMEX NGV26 contract code:
- NG represents the underlying commodity market (Henry Hub Natural Gas).
- V denotes the specific expiration month code (where V corresponds to October).
- 26 indicates the expiration year (2026).
Thus, the NGV26 code identifies a natural gas futures contract expiring in October 2026.
Tracking expiration dates is critical because it identifies when the obligation to settle occurs, or when costs must be incurred to roll exposure into a subsequent contract expiration. This process—known as the expiration rollover—allows traders to maintain open market exposure by transitioning into a later maturity. Rollover expenses can represent a significant operational cost, making their calculation vital when managing active futures positions.
Additionally, traders must evaluate initial and maintenance margin requirements prior to opening a position. These requirements directly dictate the level of leverage permitted by the Exchange. While leverage enhances prospective returns, it proportionally amplifies potential capital losses, rendering margin monitoring a cornerstone of position risk management.
Key parameters for trading natural gas
Quantitative risk assessments in natural gas futures depend entirely on contract specifications. For instance, the standard NYMEX Henry Hub contract covers a total volume of 10,000 MMBtu (Million British Thermal Units). Consequently, the minimum price fluctuation—known as a tick—is set at 0.001 per MMBtu, giving each tick a monetary value of $10.00.
Understanding tick values allows traders to establish precise profit targets (take-profit) and downside limits (stop-loss). For example, a target set 100 ticks away from the entry price equates to a profit objective of $1,000 ($10 * 100). Conversely, a stop-loss positioned 50 ticks from entry limits the trade's risk exposure to $500 ($10 * 50).
Crucially, official specifications—including contract size, tick increment, expiration schedules, and margin tiers—are set exclusively by the listing Exchange. Traders must verify these details directly on the Exchange's official portal before executing strategy projections.
What fundamentals determine the price of natural gas?
The demand side of the natural gas market is characterised by extreme sensitivity to weather patterns. This dynamic manifests in pronounced seasonal cycles, driven by space-heating requirements during winter months and electricity demand for air conditioning during summer peak periods.
On the supply side, global production rates, infrastructure bottlenecks, or export capacities continuously shape market equilibrium. Meanwhile, price movements are frequently driven by structural trends alongside deviations between published fundamental data and prevailing market consensus estimates.
Weekly inventories from the Energy Information Administration (EIA)
The US Energy Information Administration (EIA) issues its Weekly Natural Gas Storage Report every Thursday. This publication details natural gas inventory levels across US regions alongside historical comparisons. Because the report includes consensus forecasts from market analysts, traders rapidly evaluate whether net injections or withdrawals aligned with expectations. Discrepancies between reported inventory levels and market forecasts routinely trigger sharp spikes in implied volatility and price action.
Main sources of information for analysing natural gas futures
While numerous public and private entities report on energy markets, three primary institutions provide comprehensive coverage for natural gas analysis:
- US Energy Information Administration (EIA): Provides authoritative weekly inventory data, alongside monthly reports detailing US consumption, production, and storage metrics.
- CME Group (NYMEX): The exchange where the Henry Hub contract is listed, it offers official specifications on contract size, tick values, settlement rules, expiration calendars, and margin brackets.
- International Energy Agency (IEA): Publishes quarterly and annual global market reports, offering macro-level analysis on international demand trends, supply security, and global LNG trade balances.
Conclusion
Trading natural gas futures successfully demands a disciplined approach that integrates contract mechanics with fundamental analysis. Mastering operational parameters—such as contract nomenclature, rollover dynamics, and tick valuations—enables traders to calibrate leverage and establish precise risk thresholds. Furthermore, tracking weekly EIA storage figures and broader seasonal demand trends provides the clarity needed to navigate this dynamic energy market.
If you're interested in trading indices, foreign exchange, shares, or commodities, consider exploring the CFD contracts offered by Equiti Group. Please note that trading leveraged derivatives involves a high level of risk and may not be suitable for all investors.
FAQs
What are the main derivative contracts for trading natural gas?
Natural gas is primarily traded through futures contracts, financial options, and Contracts for Difference (CFDs). Futures impose a binding obligation to buy or sell at an agreed price and date; options provide the right—but not the obligation—to execute a trade in exchange for a premium; and CFDs allow participants to speculate on price movements without acquiring or physically settling the underlying commodity.
What are the main global benchmarks in natural gas futures markets?
The three dominant geographical benchmarks are the Henry Hub contract in the United States (listed on NYMEX), the Title Transfer Facility (TTF) contract in Europe (traded on ICE), and the Japan Korea Marker (JKM), which serves as the key pricing benchmark for Asian LNG markets (also listed on ICE).
Why is it crucial to understand the nomenclature and characteristics of a futures contract?
Understanding contract codes allows traders to identify the market, expiration month, and contract year, which is essential for planning trade execution and managing rollover costs. Likewise, knowing the contract size, tick value, and Exchange margin requirements is necessary to calculate profit targets, position stop-losses, and manage leverage risk.
What impact does the EIA's weekly inventory report have on prices?
Published every Thursday, the EIA's Weekly Natural Gas Storage Report details regional storage volumes across the US. When reported figures diverge from consensus analyst estimates, the imbalance between expectations and actual data typically triggers immediate volatility in natural gas prices.