Help
How to read trading charts: a beginner's guide
Trading charts show how asset prices change over time, helping traders identify market trends, key price levels and potential trading opportunities. This beginner's guide explains how to read trading charts by interpreting chart types, candlesticks, price patterns and technical indicators.

Trading charts display historical price movements, helping traders analyse trends and market conditions across different financial markets.
Line, bar and candlestick charts present price information differently, with candlestick charts showing the open, high, low and close for each selected time interval.
Reading trading charts involves identifying price trends, support and resistance levels, chart patterns and signals from technical indicators.
Chart patterns and technical indicators can support market analysis, but their signals do not guarantee future price movements.
What is a trading chart?
Trading charts organise price data visually, allowing traders to examine historical price behaviour and changes in market direction.
Most trading charts have two main axes:
- Horizontal axis (X-axis): Represents time, showing when price movements occurred.
- Vertical axis (Y-axis): Represents price, showing the levels an asset has reached over the displayed period.
Traders can use different chart timeframes to see how prices move over different periods. On a five-minute candlestick chart, each candle represents five minutes of price activity, while each candle on a daily chart represents one daily trading period. The chart can display multiple candles covering a longer period.
Understanding the main types of trading charts
Trading platforms offer several chart types, with line, bar and candlestick charts among the most common. Each presents price data differently, allowing traders to choose the level of detail they want to examine.
Line charts
A line chart connects a series of price points, usually the closing prices for each selected period. It provides a simple view of price movements and helps traders identify overall trends without showing the full range of price changes within each period.
Bar charts
A bar chart displays four price points for each timeframe: the open, high, low and close (OHLC). Each vertical bar represents the full price range, with a small horizontal mark on the left indicating the opening price and one on the right indicating the closing price.
Bar charts provide more detail than line charts, allowing traders to examine price ranges within individual intervals.
Candlestick charts
Candlestick charts also display OHLC prices, but use rectangular bodies and thin lines called wicks (also known as shadows) to illustrate the relationship between them.
Colours typically indicate whether the price closed above or below its opening level, while the body and wicks make it easier to compare price ranges across successive intervals.
How do you read a candlestick chart?
Reading a candlestick chart starts with understanding the four prices represented by each candle, known as OHLC:
- Open: The price at the beginning of the selected timeframe.
- High: The highest price reached during the timeframe.
- Low: The lowest price reached during the timeframe.
- Close: The price at the end of the timeframe.
The candlestick's body extends between the opening and closing prices, while its upper and lower wicks indicate the highest and lowest prices reached. Together, the body and wicks represent the full price range within that timeframe.
For example, suppose an asset records an opening price of $100, a high of $108, a low of $98 and a closing price of $105. The resulting candle has a body extending from $100 to $105, an upper wick reaching $108 and a lower wick extending to $98.
A bullish candlestick forms when the closing price is higher than the opening price, typically appearing green. A bearish candlestick forms when the closing price is lower than the opening price, typically appearing red. These colours may vary depending on the trading platform's settings. A doji candlestick forms when the opening and closing prices are equal or nearly equal, often indicating market indecision.
The size of the body and wicks can provide further insight into price behaviour. A long body indicates a relatively large difference between the opening and closing prices, while a long wick shows that price extended considerably beyond the candle's body during the interval. For instance, a long upper wick may suggest that higher prices encountered selling pressure, although it does not necessarily indicate a trend reversal.
Individual candlesticks are most useful when interpreted alongside surrounding price movements, the prevailing trend and the selected timeframe.
How to identify market trends on a trading chart
Traders identify trends by examining successive price highs and lows, which reveal the broader direction of price movements beyond individual candlesticks.
Trading charts commonly show three types of market conditions:
- Uptrend: Price generally forms higher highs and higher lows, indicating an upward direction despite occasional declines.
- Downtrend: Price generally forms lower highs and lower lows, indicating a downward direction despite temporary increases.
- Sideways market: Price fluctuates within a relatively horizontal range, without establishing a clear upward or downward trend.
Traders can also draw trendlines to visualise market direction, typically connecting selected higher lows in an uptrend or lower highs in a downtrend. These lines help illustrate the direction of price movements and may highlight areas where price could react, although their placement involves some judgement.
Trends rarely move in a straight line. Short-term fluctuations may occur within a broader trend, and different timeframes can reveal different market directions. Comparing charts across different timeframes, known as multiple-timeframe analysis, can help traders distinguish short-term movements from broader market trends.
How to identify support and resistance levels
Support and resistance are price areas where an asset's movement has previously slowed or reversed. Traders monitor these areas to assess whether prices may react again or break through them.
- Support: A price area where buying interest has previously been strong enough to slow or reverse a decline.
- Resistance: A price area where selling interest has previously been strong enough to slow or reverse an increase.
Traders identify potential support and resistance by examining previous price highs and lows, particularly areas where prices have repeatedly reversed direction. For example, if an asset repeatedly falls towards $100 before recovering, traders may identify that area as potential support. Similarly, if prices repeatedly rise towards $120 before declining, traders may identify that area as potential resistance.
Support and resistance are better understood as price zones rather than exact levels, since prices may react within a range instead of reversing at precisely the same point.
A breakout occurs when price moves above resistance or below support, potentially signalling a change in market conditions. However, not every breakout leads to a sustained move, and prices may return to their previous range. Higher trading volume accompanying a breakout may provide additional support for the move, although it does not guarantee that the breakout will be sustained. In some cases, former resistance becomes support, or former support becomes resistance.
What do trading chart patterns tell you?
Trading chart patterns are recognisable formations created by price movements over time. Traders use them to assess whether an existing trend may continue or whether market direction could change.
Chart patterns generally fall into two categories:
- Continuation patterns: Formations that may indicate an existing trend could resume after a period of consolidation.
- Reversal patterns: Formations that may indicate a potential change in the prevailing trend.
Common examples include:
- Triangles: Form when price fluctuates within a narrowing range between converging trendlines. Common variations include ascending, descending and symmetrical triangles. A breakout above or below the pattern may suggest a continuation of the prevailing trend or a potential reversal.
- Flags and pennants: Short-term consolidation patterns that may form after a strong price movement. Traders typically interpret them as potential continuation patterns when prices break out in the direction of the preceding trend.
- Head and shoulders: Typically appears after an uptrend and consists of three peaks, with the middle peak higher than the two on either side. Traders watch for a break below the neckline, which connects the lows between the peaks, as a possible indication of a bearish reversal.
- Double tops and bottoms: Reversal patterns that form when price tests a similar high or low twice. A double top may suggest a potential bearish reversal, while a double bottom may indicate a potential bullish reversal, particularly when the pattern is confirmed by a break of its intervening price level.
Chart patterns are best interpreted alongside the prevailing trend, support and resistance levels, and broader market conditions. They can suggest potential price movements but do not guarantee future outcomes.
How technical indicators help you read trading charts
Technical indicators are calculations based on market data, such as price and volume, that help traders assess trends, momentum and potential changes in market conditions. They provide additional context when interpreting charts, but their signals should be considered alongside price movements rather than in isolation.
Three commonly used indicators include:
- Moving averages: Smooth out price fluctuations to help traders identify overall trends. They are usually displayed as lines on a price chart. When moving averages calculated over different periods cross, it may signal a change in trend direction or momentum, although these signals are not always reliable.
- Relative Strength Index (RSI): Measures the speed and magnitude of recent price changes to assess momentum. It is usually displayed in a separate panel below the price chart. The RSI commonly uses 14 periods, with readings above 70 and below 30 traditionally indicating overbought and oversold conditions, respectively, rather than guaranteed price reversals.
- Moving Average Convergence Divergence (MACD): Uses the relationship between moving averages to help assess trend direction and momentum. It is typically displayed below the price chart.
Suggested exhibit: Technical indicators on a trading chart
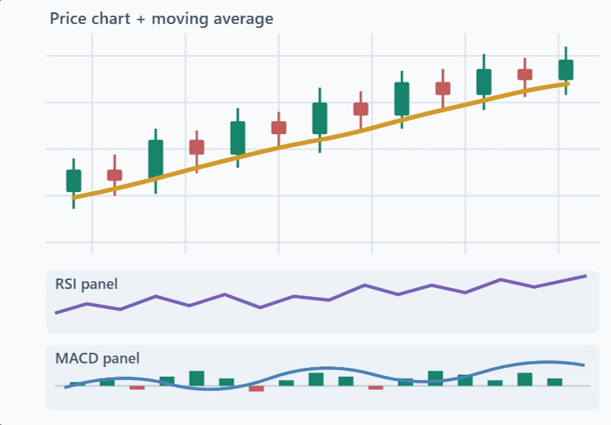
Exhibit description: Illustrative example showing a moving average overlaid on a candlestick chart, with RSI and MACD displayed in separate panels below. The illustration does not represent real market data or trading signals.
Some charts also display volume, which provides context about trading activity. On centralised exchanges, volume generally reflects the quantity traded, while spot forex platforms commonly display tick volume, which measures the frequency of price updates rather than total market-wide trading volume.
Technical indicators may provide useful insights, but their signals can lag behind price movements or prove misleading. Interpreting them alongside price trends and key support and resistance zones helps place their readings in context.
How to analyse a trading chart in five steps
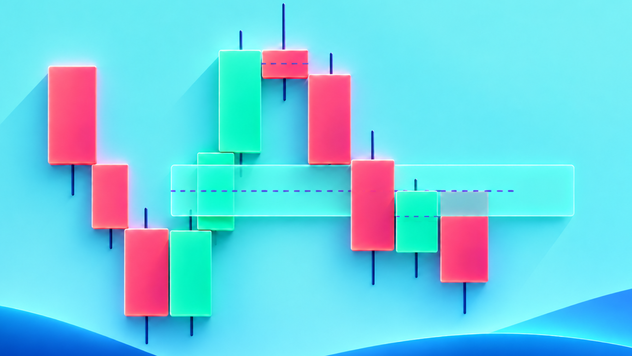
Reading a trading chart involves looking at price movements, identifying the overall trend and checking key price levels and technical indicators. The following five steps use the example chart below, which shows a market moving sideways, to explain how these elements work together.
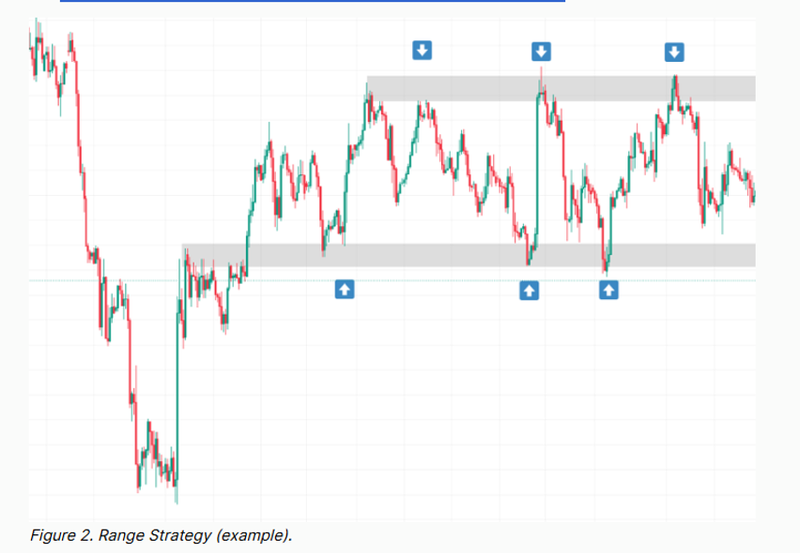
Internal note: image source: article “Source: Support and resistance trading strategy” @ Support and resistance trading strategy / remove embedded caption from image 'Figure 2.Range Strategy (example), and use this Figure description: Example of a sideways trading range, highlighting repeated price reactions around support and resistance zones.
Step 1: Choose a chart type and timeframe
Trading charts are available through online charting tools and trading platforms, where users can select different chart types, timeframes and technical indicators. Start by selecting a chart type and timeframe based on the period you want to examine. Different chart types display price information in different ways, while the timeframe determines how much time each data point represents.
For example, a daily timeframe shows one trading day per candle, while shorter intervals provide a closer view of intraday movements. Comparing a daily chart with an hourly chart can help traders understand how shorter-term price movements relate to the broader market trend.
Step 2: Identify the overall market trend
Examine successive price highs and lows to determine whether the market is moving upwards, downwards or sideways.
In the example chart, prices initially decline sharply before recovering and fluctuating within a relatively horizontal range. The repeated movements between the upper and lower boundaries suggest a sideways market during the later period shown.
Step 3: Mark support and resistance zones
Identify areas where prices have repeatedly slowed or reversed direction.
In the example chart, prices repeatedly rebound near the lower shaded zone and retreat near the upper shaded zone. These areas can therefore be identified as potential support and resistance, respectively.
The zones highlight previous price reactions rather than guaranteed turning points.
Step 4: Examine candlesticks and chart patterns
Examine candlesticks near the marked support and resistance zones, paying attention to their bodies, wicks and closing prices. Look for any recognisable patterns that may provide additional context.
In the example chart, several price movements reverse near the shaded zones. Examining the candles around these reactions can help traders assess how prices behaved when approaching support or resistance, although individual candles cannot reliably predict what happens next.
Step 5: Check technical indicators for additional context
Add a moving average to help assess the broader price direction, or use RSI or MACD to examine momentum.
The example chart does not show these indicators, but they can be added on many trading platforms. For example, a relatively flat moving average may indicate that prices are moving sideways. However, indicators should be used alongside price charts rather than relied on as signals on their own.
Common mistakes when reading trading charts
Beginners can misinterpret trading charts by focusing on isolated price movements, overlooking market context or placing too much confidence in technical signals.
Some of the most common mistakes include:
- Interpreting individual candles in isolation: Drawing conclusions from a single candlestick without examining surrounding price movements, the broader trend or nearby support and resistance zones.
- Overlooking the timeframe: Assuming a short-term price movement represents the broader trend without checking whether longer-term charts show a different direction.
- Treating support and resistance as fixed barriers: Assuming prices must reverse at a particular level instead of recognising that these areas can be crossed or broken.
- Overloading charts with indicators: Adding too many indicators can make charts difficult to interpret, particularly when several provide similar information. Focus on a small number of relevant tools and consider their readings alongside price movements.
- Mistaking potential signals for certainty: Assuming a chart pattern or breakout guarantees a particular outcome. Patterns can fail, and prices may move differently from what historical behaviour suggests.
- Ignoring market-moving events: Overlooking economic announcements, interest rate decisions or unexpected news that can trigger sharp price movements and disrupt established chart patterns.
Avoiding these common mistakes can help traders take a more balanced approach to chart analysis. Charts can help traders identify trends, assess key price levels and understand potential market movements, but technical signals are not always reliable and should be considered alongside broader market conditions.
Frequently asked questions
Which trading chart is best for beginners?
Line charts are generally the easiest for beginners to understand because they show overall price direction without additional detail. Candlestick charts provide more information, including opening, high, low and closing prices, making them useful for learning how prices move within each interval.
How do you read stock charts?
To read a stock chart, examine how the share price has changed over time, identify trends and key support and resistance levels, and assess relevant candlestick patterns or technical indicators. Trading volume and company announcements, particularly earnings reports, can provide additional context about price movements.
Can trading charts predict future prices?
Trading charts cannot predict future prices with certainty. They help traders analyse historical price movements, identify trends and recognise patterns that may suggest potential market scenarios. However, technical signals can fail, and unexpected events may cause prices to move differently from anticipated patterns.
What is the difference between technical and fundamental analysis?
Technical analysis focuses on price movements, chart patterns and indicators to assess market behaviour. Fundamental analysis examines underlying factors that may influence an asset's value, such as economic conditions, interest rates and company earnings. Traders may combine both approaches to understand not only how prices are moving, but also what may be influencing those movements.