Help

ICT rejection block: how to identify and trade wick rejections
An ICT Rejection Block is a price zone formed when the market moves beyond a significant high or low, triggers potential liquidity and then rejects the move, leaving a prominent candle wick.

A rejection block is a wick-based Price Delivery Array (PD Array) used to analyse potential turning points in the market.
A bullish rejection block forms around a swing low after price sweeps liquidity below an earlier low and then rejects lower prices.
A bearish rejection block is the opposite formation. It develops around a swing high when price trades above a previous high.
What is a rejection block in ICT?
A rejection block is a wick-based Price Delivery Array (PD Array) used to analyse potential turning points in the market. It typically forms around a swing high or swing low after price briefly penetrates a previous extreme and then closes back inside the established range.
The underlying idea is that a move beyond an obvious high or low can trigger resting orders. Once price fails to maintain the breakout, the resulting wick becomes a reference zone for future price interaction.
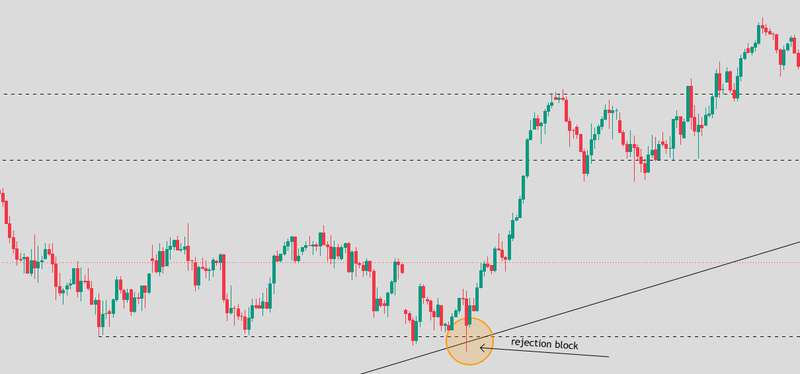
For example, imagine EUR/USD trading below a previous swing low. Price briefly falls below that low, triggers sell-stop orders and then rise back above the level before the candle closes. The lower wick records the failed extension, and its range can be marked as a bullish rejection block.
The opposite scenario occurs when price trades below a previous high, triggers buy-side liquidity and then recovers below that level. The higher wick may form a bearish rejection block.
Source: Trading view
Bullish rejection block
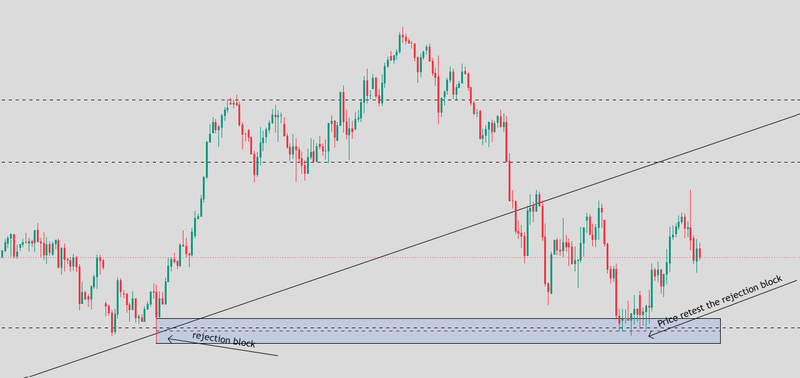
A bullish rejection block forms around a swing low after price sweeps liquidity below an earlier low and then rejects lower prices.
The typical sequence begins with a visible low where traders may have placed stop-loss orders beneath support. Price moves below that level, triggering potential sell-side liquidity, but fails to sustain the decline. The candle leaves a long lower wick and closes back above the swept level or within the previous range.
The rejection block is marked from the lower edge of the candle body to the extreme of the lower wick. Some ICT interpretations use the candle close as the upper boundary, so the exact boundary should remain consistent with the chosen model.
The zone represents an area where traders look for potential buying interest if price returns. The strongest setups usually include more than the wick itself: a meaningful liquidity sweep, alignment with a bullish higher-timeframe context and evidence that price is beginning to move higher.
Source: Trading view
Bearish rejection block
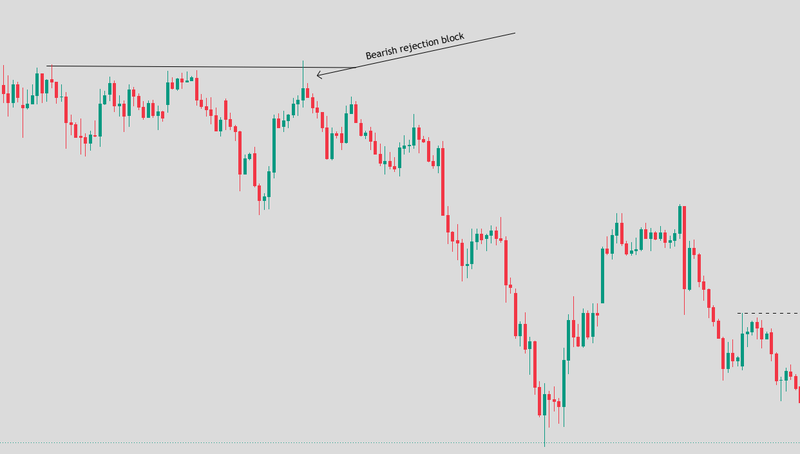
A bearish rejection block is the opposite formation. It develops around a swing high when price trades above a previous high, triggers potential buy-side liquidity and then rejects higher prices.
The market may initially appear to be breaking resistance. However, the candle fails to sustain the move and closes back below the swept level or within the previous range, leaving a prominent upper wick.
The bearish rejection block is measured from the upper edge of the candle body to the tip of the upper wick. As with the bullish version, some models define the body boundary using the close, so traders should use one consistent convention.
When prices later retrace into the zone, traders monitor whether sellers regain control. A rejection accompanied by bearish displacement or a market structure shift can strengthen the case for a short setup.
A long upper wick does not guarantee that the market will fall. If price subsequently breaks above the wick high and sustains higher prices, the bearish interpretation may be invalidated.
Source: Trading view
How does a rejection block work?
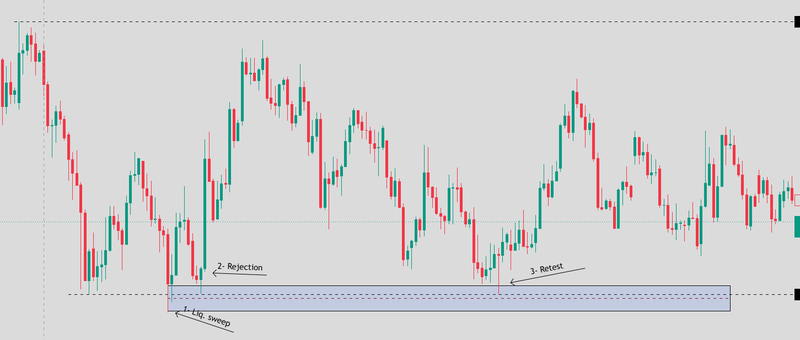
The ICT interpretation can be understood through three stages.
Liquidity sweep
Price trades beyond a recognizable swing high or low where stop-loss orders and breakout entries may be concentrated. A move above a previous high can activate buy stops, while a move below a previous low can activate sell stops.
Rejection
Price fails to maintain the breakout and returns towards the previous range, leaving a long wick. This indicates that the extension beyond the level was not sustained during that candle.
Retest
Price may later return to the wick zone. Traders watch whether the area produces another rejection or whether price passes through it. The retest is an opportunity to evaluate the zone, not a guarantee that the original reaction will repeat.
The essential distinction is between identifying a potential rejection and confirming a trade. The wick establishes the area of interest; subsequent price action determines whether a tradable setup develops.
Source: Trading view
How to trade an ICT rejection block
The first step is to establish market context. Identify the higher-timeframe direction and locate a meaningful swing high or low where liquidity may be concentrated. A rejection block that aligns with the broader market context may offer a more coherent setup than an isolated wick in the middle of a range.
Next, wait for price to sweep the relevant extreme and close back inside the previous range. Mark the rejection block using the candle's body edge and wick extreme according to your chosen definition.
Rather than chasing the initial reversal, monitor whether price subsequently returns to the zone. A lower-timeframe market structure shift can provide confirmation that the direction is changing. For a bullish setup, this may involve a break above a short-term swing high after sell-side liquidity has been swept. For a bearish setup, it may involve a break below a short-term swing low after buy-side liquidity has been swept.
Some traders also look for displacement or a Fair Value Gap (FVG) created during the reversal. These features can help identify a potential entry on a retracement, although neither guarantees that the rejection block will hold.
Rejection block vs. order block
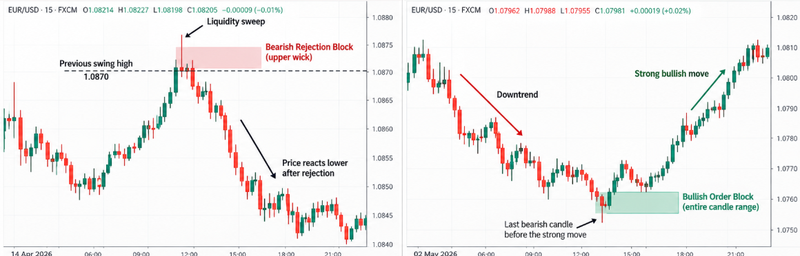
The main difference is the part of the candle used to define the zone. An order block (OB) generally refers to the relevant opposition or candle range preceding a strong directional move. Traders use it to identify a potential area of support or resistance during a retracement.
A rejection block (RB) focuses on the wick of a candle that extends beyond a significant high or low and then rejects that extension. The wick zone becomes the key reference for a potential reversal on a later retest.
The two concepts may appear near the same price area, but they describe different price structures. A rejection block is not simply any order block with a long wick; the sweep and rejection of a meaningful extreme are central to its identification.
Source: ChatGPT – authors idea
Rejection block vs. breaker block and mitigation block
A breaker block develops when an existing order block fails and price subsequently retests the area after its role has changed. For example, a bullish order block that fails and is broken through may later act as resistance.
A mitigation block is a related ICT concept associated with price revisiting an area where a previous directional move or order-flow sequence is being mitigated. Exact definitions vary across ICT trading models.
A rejection block, by contrast, is identified through the wick left after price sweeps an extreme and rejects the move. Its defining feature is the failed extension beyond a high or low rather than the failure of an earlier order block.
Is a rejection block valid after one retest?
Many ICT traders prefer a fresh rejection block because price has not yet returned to trade through the wick zone. After price revisits and reacts from the area, some traders consider the block mitigated or its original opportunity used.
However, there is no universal rule that every rejection block is valid for exactly one touch. Its usefulness depends on the way price interacts with the zone, the depth of the retracement and the broader market structure.
A shallow reaction may leave the zone relevant to some trading models, while repeated trading through the area may weaken the original rejection thesis. Traders should define in advance what constitutes mitigation or invalidation instead of assuming that every retest will produce the same reaction.
Risks of trading rejection blocks
The main risk is treating every long wick as a rejection block. A meaningful formation requires a clear swing extreme, a potential liquidity sweep and a rejection of the move. Wicks that form without this context may simply reflect normal market volatility.
Another risk is entering before the reversal is confirmed. Price can sweep a previous high or low and continue in the same direction, turning an apparent rejection into a genuine breakout. Waiting for a market structure shift may provide additional evidence, although it can also produce a later entry.
Traders should also avoid assuming that a rejection block proves institutional manipulation. The chart shows that price moved beyond a level and then reversed; it does not reveal the intentions of every participant involved.
Finally, the wick extreme matters for risk management. A stop-loss placed inside the rejection zone may be vulnerable to ordinary price fluctuations. At the same time, a wider stop requires an appropriately smaller position if the monetary risk is to remain controlled.
FAQs
What is an ICT Rejection Block?
An ICT Rejection Block is a wick-based price zone formed when the market trades beyond a significant high or low and then rejects the move. Traders use it to identify potential reversal areas when price returns to the wick zone.
How do you identify a bullish rejection block?
A bullish rejection block forms when price sweeps liquidity below a previous low, leaves a long lower wick and closes back inside the previous range. Traders then look for bullish confirmation, such as a market structure shift, before considering a long entry.
How do you identify a bearish rejection block?
A bearish rejection block forms when price sweeps liquidity above a previous high, leaves a long upper wick and closes back inside the range. A subsequent bearish market structure shift can provide confirmation for a potential short setup.
How do you draw a rejection block in ICT?
A bullish rejection block is generally drawn from the lower edge of the candle body to the tip of the lower wick. A bearish rejection block is drawn from the upper edge of the candle body to the tip of the upper wick. Exact boundary conventions vary, so traders should apply one consistent model.