Help

Inside bar trading strategy: How to trade breakouts and continuation
The inside bar trading strategy identifies periods of price consolidation that may lead to breakouts or trend continuation, helping traders plan entries around clearly defined price levels.

Inside bars form when a candle trades entirely within the previous candle's range.
Breakouts above or below the mother bar can signal renewed momentum.
Trend direction and market structure help filter trading opportunities.
False breakouts and stop-loss placement are critical considerations.
What is an inside bar trading strategy?
An inside bar trading strategy is a price action method that identifies potential breakouts or trend continuation opportunities following a period of market consolidation. The pattern consists of two candlesticks, with the second candle's high and low contained entirely within the range of the previous candle, known as the mother bar.
This structure indicates that price movement has temporarily contracted. Buyers have failed to push the market above the previous high, while sellers have been unable to break below the previous low.
Traders monitor these patterns because periods of reduced volatility can precede stronger directional movements. A breakout above the mother bar may indicate renewed buying momentum, while a break below it can signal increasing selling pressure.
However, the inside bar itself is directionally neutral. Its significance depends on the prevailing trend, nearby support and resistance levels, and the strength of the subsequent breakout.
How to identify an inside bar candlestick pattern
An inside bar is defined by the relationship between two consecutive candles rather than their individual colors or body sizes.
The first candle, called the mother bar, establishes the reference range. The second candle must have a lower high and a higher low, keeping its entire price movement, including both wicks, within the mother bar's boundaries.
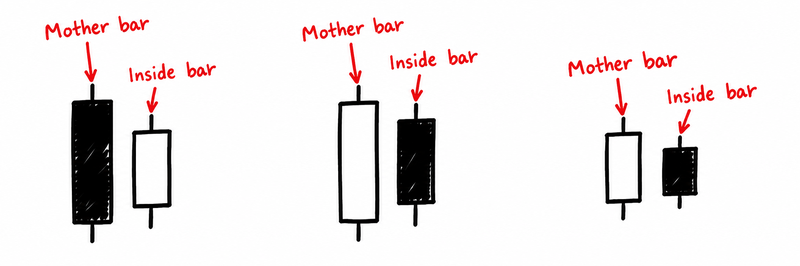
For example, if a mother bar reaches a high of 1.1050 and a low of 1.0950, the following candle qualifies as an inside bar only if its high remains below 1.1050 and its low stays above 1.0950.
Both candles can be bullish, bearish, or different colors. The relationship between their highs and lows determines whether the pattern is valid.
Some traders also accept matching highs or lows, but requiring strict containment provides a clearer and more consistent definition for identifying and backtesting the pattern.
Why inside bars form before market breakouts
Financial markets frequently alternate between periods of expansion and consolidation. After a strong directional movement, traders may take profits while other participants wait for more favorable prices before entering.
This temporary balance can produce a narrower trading range, creating an inside bar.
In an established uptrend, an inside bar may indicate that selling pressure during a pullback remains limited. If buyers subsequently push above the mother bar's high, the previous upward movement may resume.
During a downtrend, the same structure can reflect a temporary pause before selling pressure returns.
However, consolidation does not guarantee a strong breakout. Some inside bars form simply because trading activity has declined, particularly during quiet sessions or ahead of major economic announcements.
The surrounding market structure helps distinguish potentially meaningful consolidation from ordinary price fluctuations.
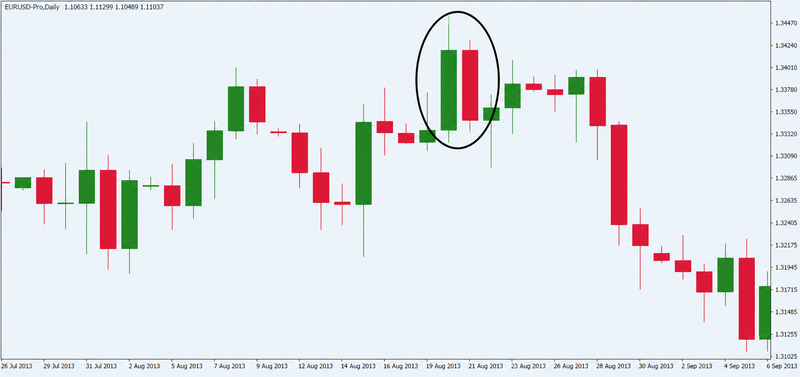
Inside bar breakout vs. continuation strategy
Inside bars can be traded as breakout patterns or as continuation setups. Although both approaches use the same candlestick structure, their market conditions differ.
Inside bar breakout strategy
A breakout strategy focuses on prices moving beyond the mother bar's established range.
Traders identify the mother bar's high and low, then wait for the market to break either boundary. A move above the high creates a potential bullish setup, while a move below the low suggests a bearish opportunity.
The quality of the breakout depends on its strength and location. A decisive candle closing outside the mother bar, particularly beyond established resistance or support, provides stronger evidence than a temporary move beyond the level.
Breakouts may also offer greater potential when they develop after an extended consolidation rather than during irregular, directionless trading.
Inside bar trend continuation strategy
A continuation strategy looks for inside bars forming during temporary pauses in an established trend.
In an uptrend, traders may search for bullish breakouts after an inside bar develops above support or following a controlled pullback. In a downtrend, bearish breakouts become more relevant after temporary recoveries toward resistance.
This approach uses the broader market direction to determine which breakout signals deserve attention.
For example, if gold is producing higher highs and higher lows, an inside bar forming after a modest pullback may offer a continuation setup if prices subsequently break above the mother bar.
The advantage of this method is that the trade direction aligns with the existing trend, although sudden reversals remain possible.
How to trade the inside bar strategy step by step
An effective inside bar trading plan establishes the market direction, breakout trigger, invalidation point, and profit target before the trade begins.
- Identify the prevailing trend
Begin with the daily or four-hour chart to determine whether the market is trending or consolidating.
Higher highs and higher lows indicate an uptrend, while lower highs and lower lows suggest a downtrend. Moving averages, such as the 20-period and 50-period averages, can provide additional context.
For continuation strategies, prioritize inside bars that develop in the direction of the broader trend.
- Locate the mother bar and inside bar
Identify a candle whose entire range falls inside the previous candle.
Mark the mother bar's high and low because these levels establish the principal breakout boundaries.
The size of the mother bar matters. An unusually large range can require a wide stop-loss, while an extremely narrow pattern may produce breakouts too small to overcome transaction costs.
- Wait for breakout confirmation
There are two common entry approaches.
Breakout entry: Place a buy-stop order slightly above the mother bar's high for a bullish setup or a sell-stop order below its low for a bearish setup.
Breakout-and-retest entry: Wait for price to break the mother bar's range, then return toward the broken level before considering an entry.
A more conservative variation requires a completed candle close outside the mother bar before entering.
These methods involve different trade-offs. Early breakout entries capture moves sooner but face greater false-breakout risk. Waiting for confirmation may improve signal quality but can produce a less favorable entry price or cause traders to miss the move entirely.
- Set the stop-loss
For a bullish breakout, a conventional stop-loss is positioned below the mother bar's low. For a bearish breakout, it is placed above the mother bar's high.
Some traders use the opposite side of the smaller inside bar for a tighter stop. However, this increases the likelihood of being stopped out during a normal retest of the mother bar's range.
The stop-loss should reflect the point at which the trade's technical justification becomes invalid, with position size adjusted to the resulting risk.
- Define the profit target
Profit targets should be based on the next meaningful support or resistance level, previous swing highs or lows, and the potential reward relative to risk.
A reward-to-risk ratio of 2:1 may be attractive, but only if sufficient room exists before the next major price barrier.
If the nearest resistance sits too close to a bullish entry, the setup may offer an unfavorable risk profile despite a convincing breakout.
Multiple inside bars and volatility compression
Sometimes several consecutive candles remain inside the range of the same mother bar. This formation is commonly called a multiple inside bar pattern.
Each additional candle may represent further price compression as the market struggles to establish a new high or low.
For instance, three consecutive inside bars forming near resistance suggest that prices are consolidating within an increasingly established range. A subsequent breakout may attract traders anticipating renewed momentum.
However, multiple inside bars do not guarantee a stronger move. Extended consolidation can also produce false breakouts, particularly when overall market participation is weak.
Traders should distinguish between genuine compression within an established trend and prolonged sideways trading without a clear directional bias.
How to identify and avoid false inside bar breakouts
False breakouts are among the biggest challenges of inside bar trading.
A typical false breakout occurs when price moves beyond the mother bar's high or low but fails to sustain the move and returns inside the original range.
For example, a market may briefly break above the mother bar's high, attracting buyers, before closing back below resistance. This failed breakout can indicate weakening momentum and potentially lead to movement toward the opposite side of the range.
Some price-action traders refer to this behavior as an inside bar fakey pattern, particularly when the failed breakout produces a rejection candle before prices reverse.
Traders can reduce exposure to weaker signals by evaluating breakout candle closes, higher-timeframe trends, and nearby support or resistance.
Breakouts immediately ahead of major economic announcements also deserve caution. News-driven volatility can trigger orders on both sides of the mother bar before the market establishes a clearer direction.
No confirmation method eliminates false breakouts, making predefined risk management essential.
What are the best timeframes for inside bar trading?
Inside bar patterns appear across all timeframes, but their usefulness depends on the market and trading style.
Daily charts are popular among swing traders because they help identify consolidation within larger trends while filtering some intraday noise.
Four-hour charts offer a balance between trading opportunities and broader market structure, particularly in forex and gold markets.
One-hour and fifteen-minute charts provide more frequent signals but are generally more sensitive to short-term volatility, spreads, and irregular price movements.
A multi-timeframe approach can help traders identify the prevailing trend on the daily chart before searching for continuation setups on the four-hour or one-hour timeframe.
The appropriate timeframe should ultimately be determined through testing rather than assuming that one chart interval consistently produces better results.
Common inside bar trading mistakes
One common mistake is trading every inside bar without considering the prevailing market trend. During sideways conditions, price may repeatedly break above and below the mother bar without developing sustained momentum.
Another problem is entering before the pattern completes. A candle that initially appears contained may extend beyond the mother bar before closing, invalidating the original formation.
Traders also overlook the distance between entry and stop-loss. A large mother bar can create excessive risk, especially when the nearest profit target is relatively close.
Finally, some traders treat an inside bar as an automatic breakout signal. The pattern only identifies temporary price compression. The direction and quality of the subsequent move must be assessed separately.
Is the inside bar trading strategy profitable?
The inside bar strategy can form part of a profitable trading system, but the pattern itself does not guarantee a statistical trading advantage.
Its performance depends on trend strength, market conditions, breakout confirmation, stop placement, and transaction costs.
A continuation setup following a controlled pullback in a strong trend may behave differently from a breakout during a low-liquidity trading session.
Traders should backtest clearly defined rules across multiple market environments, measuring win rate, average reward relative to risk, drawdown, and the frequency of false breakouts.
Comparing results between mother bar breakouts, inside bar breakouts, and breakout-and-retest entries can also help identify which approach is more suitable for a particular market.
What makes an inside bar breakout worth trading?
The strongest inside bar opportunities generally develop when a clear market trend, meaningful price structure, and temporary volatility contraction occur together.
The mother bar establishes the trading range, while the inside bar identifies the pause. A subsequent breakout provides the potential entry signal, but the surrounding market conditions determine whether the setup offers sufficient opportunity.
For traders, the priority is selecting breakouts supported by market structure, reasonable stop-loss distances, and realistic profit targets.
An inside bar provides a clear technical framework. Its value comes from how that framework is applied, tested, and managed across different market conditions.
FAQs
What is an inside bar in trading?
An inside bar is a two-candlestick pattern in which the second candle's high and low remain within the range of the previous candle, known as the mother bar. It indicates temporary price consolidation.
Is an inside bar bullish or bearish?
An inside bar is directionally neutral. A breakout above the mother bar may indicate bullish momentum, while a break below it can suggest bearish pressure. The broader market trend helps determine which direction is more relevant.
How do you trade an inside bar breakout?
Traders identify the mother bar's high and low, wait for a breakout beyond either boundary, and establish a stop-loss and profit target based on market structure and acceptable risk.
What is the difference between an inside bar and a pin bar?
An inside bar is defined by its price range being contained within the previous candle. A pin bar is identified by a long rejection wick and a small body. Inside bars primarily indicate consolidation, while pin bars emphasize price rejection.
Where should a stop-loss be placed for an inside bar trade?
For a bullish breakout, the stop-loss is commonly positioned below the mother bar's low. For a bearish breakout, it is placed above the mother bar's high. Tighter stops may be used but can increase the probability of premature exits.
Can inside bars be used for trend continuation?
Yes. Inside bars frequently form during pauses or pullbacks within established trends. Traders may use a breakout in the prevailing trend direction as a potential continuation signal, provided other conditions support the trade.
What causes an inside bar false breakout?
A false breakout occurs when prices move beyond the mother bar's range but fail to maintain momentum and return inside it. Weak market participation, nearby support or resistance, and sudden volatility can contribute to these failures.