Help
Market maker model in ICT: how to identify buy and sell models
The Market Maker Model (MMXM) is a price-delivery framework used in ICT and SMC analysis to interpret how price moves between liquidity pools. It focuses on the relationship between consolidation, liquidity sweeps, directional reversals and price delivery towards opposing levels.

The Market Maker Model is a trading schematic built around the idea that price moves through different phases as liquidity is created.
The original consolidation is the initial range from which the model's directional movement develops.
The Market Maker Buy Model describes a sequence in which price moves lower before reversing and delivering higher.
The Market Maker Sell Model is the bearish counterpart to the buy model.
What is the Market Maker Model (MMXM)?
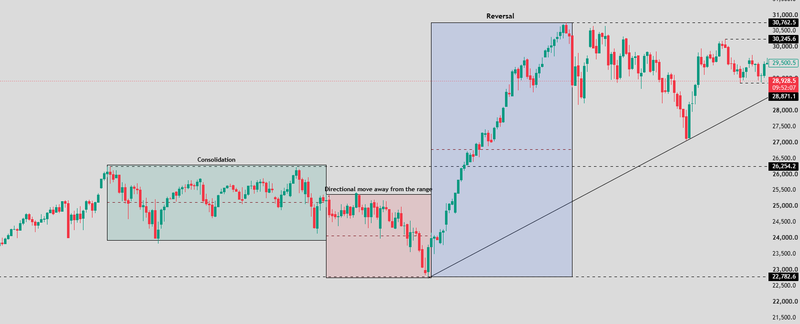
The Market Maker Model is a trading schematic built around the idea that price moves through different phases as liquidity is created, accessed and targeted. In ICT terminology, these phases are often described through an original consolidation, a directional move away from the range, a reversal near a significant price level and a move back towards the initial area or another liquidity target.
The model is often applied alongside liquidity concepts, market structure, Fair Value Gaps (FVGs) and other Price Delivery Arrays (PD Arrays). These tools help traders identify where a reversal might develop and where price could be retraced during the subsequent move.
However, the model should be treated as an interpretive framework rather than proof that a particular institution is deliberately engineering every price movement. Charts show price and depending on the market, volume or order-book information. They do not reveal the intentions of all market participants.
Source: Trading view
Key components of the Market Maker Model
Original consolidation
The original consolidation is the initial range from which the model's directional movement develops. It provides a reference for analyzing the subsequent price path and identifying whether price returns towards the starting area.
Liquidity engineering
Liquidity engineering is the ICT term used to describe price action that creates or draws attention to areas where orders may accumulate. Repeated highs, repeated lows, trendlines and obvious support or resistance can attract stop-loss and breakout orders.
When price crosses these levels, the resulting order flow may accelerate the move. However, the presence of a liquidity pool does not establish that a particular participant deliberately engineered it.
Smart Money Reversal (SMR)
Smart Money Reversal is the potential turning point where the prevailing directional move gives way to movement in the opposite direction. Within MMXM analysis, traders look for a meaningful price level, a liquidity event and evidence of a structural shift.
Price Delivery Arrays (PD Arrays)
PD Arrays are technical reference areas used in ICT analysis to assess potential support, resistance and retracement locations. They include order blocks, breaker blocks, FVGs and other price structures.
When a potential reversal aligns with a higher-timeframe PD Array, traders may monitor lower-timeframe price action for an entry. The alignment adds context, but it does not guarantee that the level will hold.
Market Maker Buy Model (MMBM)
The Market Maker Buy Model describes a sequence in which price moves lower before reversing and delivering higher. Traders use it to look for potential bullish opportunities after sell-side liquidity has been taken.
Original consolidation
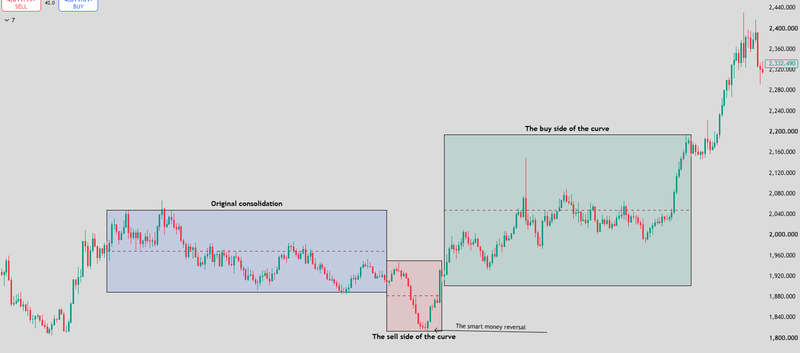
The model begins with an original consolidation, where price trades within a relatively narrow range. This range establishes an initial reference point for the subsequent price movement.
Traders mark the consolidation's boundaries and identify nearby liquidity, including previous swing highs and lows. The range may later become a reference for assessing whether price is returning to its starting area.
The sell side of the curve
Price moves lower from the original consolidation, potentially breaking short-term support and passing through previous lows. These moves can trigger sell-side liquidity, including stop-loss orders from traders holding long positions and sell-stop entries from breakout traders.
The decline may contain several smaller consolidations and Fair Value Gaps. Within the MMXM framework, these features help traders map the path of price as it moves towards a lower liquidity pool or a higher-timeframe bullish PD Array.
The key question is whether the decline is continuing with bearish momentum or approaching an area where a reversal could develop. A lower low alone does not establish that the market is preparing to move higher.
The smart money reversal
The potential turning point occurs when price reaches a significant area and begins to reject lower prices. This may include a higher-timeframe bullish order block, an FVG, a previous low or another area associated with sell-side liquidity.
Traders then look for evidence that bearish momentum is weakening, and bullish price delivery is beginning. A liquidity sweep followed by bullish displacement and a market structure shift can provide stronger evidence than the initial touch of the zone.
This reversal phase is central to the MMBM. Entering before price confirms a change in structure can expose traders to further downside if the apparent reversal is only a temporary retracement.
The buy side of the curve
Once bullish momentum develops, price may move higher through the areas it previously crossed during the decline. Traders monitor intermediate swing highs, smaller consolidations and FVGs as potential retracement areas or price objectives.
The original consolidation can serve as one reference target, although price may reach other liquidity pools first or fail to return to the initial range entirely.
Source: Trading view
Market Maker Sell Model (MMSM)
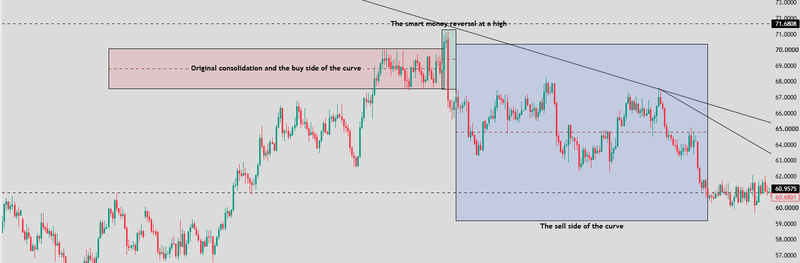
The Market Maker Sell Model is the bearish counterpart to the buy model. It describes a sequence in which prices move higher, reach a potentially important reversal area and then deliver lower.
Original consolidation and the buy side of the curve
The model begins with a consolidation that provides a reference range. Price subsequently moves higher, breaking previous highs and potentially triggering buy-side liquidity.
This upward leg may attract breakout buyers and activate buy-stop orders from traders holding short positions. In the MMXM framework, the move is monitored for signs that price is approaching a significant higher-timeframe resistance area or an opposing liquidity target.
A rising market does not automatically indicate that a reversal is imminent. Traders need to assess the broader trend, the location of liquidity and whether the upward move is showing signs of exhaustion or rejection.
The smart money reversal at a high
A potential bearish reversal may develop when price reaches a higher-timeframe bearish PD Array, such as a bearish order block or FVG, or sweeps a previous high before rejecting higher prices.
Traders then look for bearish displacement and a market structure shift, such as a break below a short-term swing low. SMT divergence between correlated assets may provide additional context if one market makes a new high while the other fails to confirm it.
These signals do not guarantee a reversal. They help traders evaluate whether the move higher is losing strength and whether bearish price delivery may be developing.
The sell side of the curve
Following a confirmed bearish shift, price may move lower through intermediate swing lows, consolidations and previously formed FVGs. These areas can help traders identify potential retracement entries and downside targets.
The original consolidation may act as a reference destination, but it is not a guaranteed endpoint. Price can encounter opposing liquidity or reverse again before reaching the starting range.
The focus is on the transition from bullish price delivery to bearish price delivery, supported by structural evidence rather than the assumption that every high represents a market top.
Source: Trading view
How to validate a Smart Money Reversal safely
The SMR is one of the most difficult parts of MMXM to trade because a market can appear to reverse several times before a genuine directional change develops. Traders who enter immediately after a liquidity sweep risk taking a position against the prevailing momentum.
Start with higher-timeframe alignment
First, identify whether price is approaching a meaningful higher-timeframe area. This could be a daily or four-hour order block, an FVG or a prominent liquidity pool.
The purpose is to establish context. A potential reversal that develops at a significant price area may offer a more coherent setup than one that appears in the middle of an established trading range without a clear structural reason.
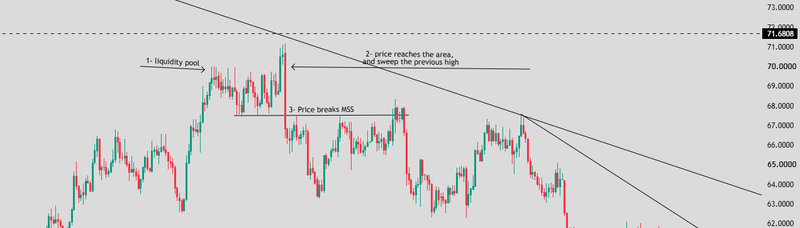
Wait for a market structure shift
After price reaches the area, move to a lower timeframe and observe whether the market begins to change direction.
For a bullish SMR, traders may wait for price to sweep a previous low and then break a short-term swing high with strong bullish displacement. For a bearish SMR, they may look for a sweep above a previous high followed by a decisive break below a short-term swing low.
The displacement matters because it provides evidence of directional momentum. A minor break without a convincing move may be less informative, particularly in choppy conditions.
Source: Trading view
Risks of trading MMXM
The main risk is forcing price action into the model. Markets do not always follow a clean sequence of consolidation, liquidity sweep, reversal and return to the origin. A decline may continue lower instead of forming a buy model, while a rally may continue higher rather than producing a sell model.
Another risk is assuming that liquidity sweeps prove institutional manipulation. They identify price moving through a level where orders may be concentrated, but they do not establish who initiated the move or why.
Higher-timeframe PD Arrays can also fail, and SMT divergence may persist without producing a reversal. Traders should avoid treating any single component as conclusive evidence.
Finally, the model can encourage premature entries if traders anticipate the SMR before a market structure shift develops. Defining the invalidation level, using appropriate position sizing and setting realistic targets are essential to managing that risk.
FAQs
What is MMXM in ICT trading?
MMXM stands for Market Maker Model. It is an ICT price-delivery framework used to interpret consolidation, liquidity sweeps, potential reversals and price movement towards opposing liquidity targets.
What is the Market Maker Buy Model (MMBM)?
The Market Maker Buy Model describes a potential bullish sequence in which price moves lower, accesses sell-side liquidity, reverses and then moves higher towards opposing liquidity targets. Traders look for confirmation through displacement and a market structure shift.
What is the Market Maker Sell Model (MMSM)?
The Market Maker Sell Model describes a potential bearish sequence in which price moves higher, accesses buy-side liquidity, reverses and then moves lower towards opposing liquidity targets.
What is a Smart Money Reversal in MMXM?
A Smart Money Reversal (SMR) is the potential turning point where price begins moving against the previous directional leg. Traders commonly look for a significant higher timeframe price level, a liquidity sweep and a market structure shift to validate the reversal.