Mastering the VWAP indicator: A comprehensive guide for traders
The Volume-Weighted Average Price (VWAP) is a technical indicator that averages the price of an asset by weighting it against its relative trading volume. Extensively utilised by institutional market participants to identify "fair value", it serves as a dynamic support or resistance level and a robust trend filter.

The VWAP incorporates transaction volume directly into its mathematical formula, unlike traditional moving averages that solely consider closing prices.
Institutional traders utilise the indicator to execute sharded order blocks without aggressively disrupting prevailing market liquidity.
It functions effectively as a directional filter: a market price sustained above the VWAP indicates a bullish bias, whereas a price below reflects underlying weakness.
Although it is natively an intraday tool, the Anchored VWAP variant allows market participants to extend this volume-weighted analysis to swing trading strategies.
What is VWAP and why it matters
The Volume-Weighted Average Price (VWAP) is an intra-session technical indicator that illustrates the price behaviour of an asset by assigning greater weight to the specific price levels where higher trading volume was executed. Essentially, if a particular price level experiences a significant influx of trading volume because the broader market perceives it as a "fair price", the VWAP formula applies a proportionally higher weighting to that level.
VWAP vs. moving averages: Key differences
Unlike traditional moving average indicators, which compute an average value independent of volume dynamics because they focus exclusively on the closing price, the VWAP embeds the volume factor into its output. Consequently, the VWAP attributes a higher valuation weight to the exact price levels where execution activity was greatest, thereby capturing the footprint of institutional investors in its final calculation.
Another structural difference is that the VWAP is primarily designed to assess intraday price behaviour and its interplay with transactional liquidity, meaning it resets automatically at the opening of each new trading session. In contrast, standard moving averages are typically applied across continuous timeframes—with the 50-day, 100-day, and 200-day variations being the most prevalent—to analyse the broader macro-structural trend of an asset.
Why professional and institutional traders use VWAP
Institutional traders routinely seek to execute substantial commercial orders via tiered or iceberg order blocks, aiming to accumulate or distribute large positions through fragmented sets of smaller orders. Given that the VWAP reflects the true "fair price" of a market by accounting for liquidity, buyers generally look to execute orders below the VWAP line, whilst sellers aim to execute above it. If institutional participants were to execute large orders without considering the available market depth, prices would slippage aggressively, thereby preventing the firm from achieving optimal average entry levels.
When VWAP works best (day trading vs. longer-term)
The standard VWAP indicator is fundamentally an intraday technical tool, which typically exhibits its highest relevance and activity during the highly liquid opening and closing tranches of the trading session. However, swing traders frequently deploy a variant known as the Anchored VWAP (AVWAP). This modification allows the user to manually select a specific chronological anchor point—such as a market high, low, or structural turning point—from which the VWAP calculations accumulate without undergoing a daily programmatic reset. The choice of reference events depends entirely on the operator, though common practice involves anchoring the tool to monthly openings, quarterly earnings reports, or the launch of an initial public offering (IPO).
How VWAP is calculated
VWAP formula
- VWAP = Sum(Price * Volume) / Sum(Volume)
Where:
- Price = Price assigned to the transaction or specific interval range (typically the typical price)
- Volume = Number of securities or contracts traded in that specific interval
Manual calculation example
The computation of the VWAP requires a dynamic, cumulative, and continuous mathematical process. The operational workflow comprises the following essential components:
- Typical Price Calculation: Most charting platforms utilise a structural variation for the price variable by calculating the arithmetic mean of the high, low, and closing prices for each specific intraday bar or selected periodicity.
- Price * Volume Product: The derived typical price is subsequently multiplied by the exact volume recorded exclusively within that specific time interval. This yields the volume-weighted price value; consequently, intervals with high volume exert a heavier mathematical influence on the final indicator line, whereas low-volume intervals are penalised.
- Cumulative Price * Volume Sum: The rolling, cumulative sum of these weighted transaction results is continuously calculated throughout the trading session.
- Cumulative Volume Sum: Concurrently, the denominator tracking the cumulative sum of all shares or contracts traded across each successive interval is updated.
- Cumulative Data Division: Finally, the running total of the Price * Volume product is divided by the cumulative sum of the Volume. The resulting quotient establishes the precise VWAP price level plotted on each updated chart bar.
The practical mechanics of this mathematical process are demonstrated in the spreadsheet figure provided below:
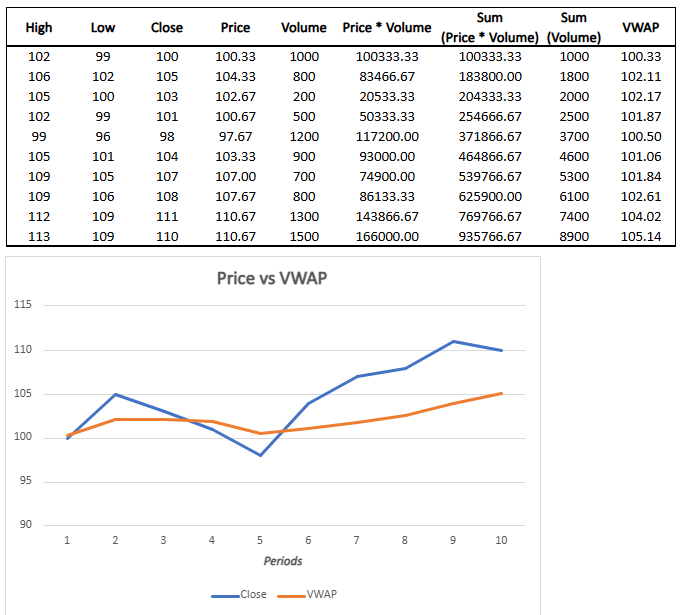
Figure 1. VWAP Computation (Example). Source: Own analysis.
How to interpret VWAP on a chart
Market sentiment: Price above vs. below VWAP
The spatial relationship between the current market price and the VWAP line offers a powerful directional filter for evaluating immediate market sentiment. The two primary structural interpretations are:
- Bullish Bias: When the market price trades sustainably above the VWAP level, it is technically interpreted as a manifestation of bullish momentum, indicating that market participants are actively willing to transact at prices higher than the volume-weighted session average.
- Bearish Bias: When the market price consistently prints below the VWAP line, it reflects structural weakness in the underlying asset due to a lack of buying pressure at higher levels. Consequently, this signals a bearish bias, suggesting that short positions may offer a higher statistical probability of success.
VWAP as dynamic support and resistance
The VWAP functions as a major zone of dynamic support or resistance depending on the dominant order-flow momentum driving the session. If the price trades well above the VWAP but subsequently retraces back towards the indicator line, institutional algorithms frequently reactivate buy orders at this junction, viewing the retest as a return to institutional "fair value" backed by volume.
Conversely, if the price trades below the VWAP following a significant downward expansion and subsequently rallies back up to the indicator line, the level frequently acts as overhead resistance. In this scenario, institutional funds often utilise the retracement to distribute or liquidate remaining holdings at a mathematically justifiable outflow price.
VWAP bands and standard deviation envelopes
Advanced trading platforms routinely superimpose statistical deviation bands above and below the core VWAP line, establishing a robust framework for volatility analysis. These bands quantify the exact mathematical dispersion of price data relative to the volume-weighted mean. The primary objective is to measure the implied volatility of the active trading session, thereby allowing traders to identify extreme mean-reversion zones or areas of exhaustion in directional trends. While charting software typically defaults to +/-1 standard deviation envelopes, users can manually configure or append the calculation to display +/-2 or +/-3 standard deviation boundaries based on historical volatility regimes.
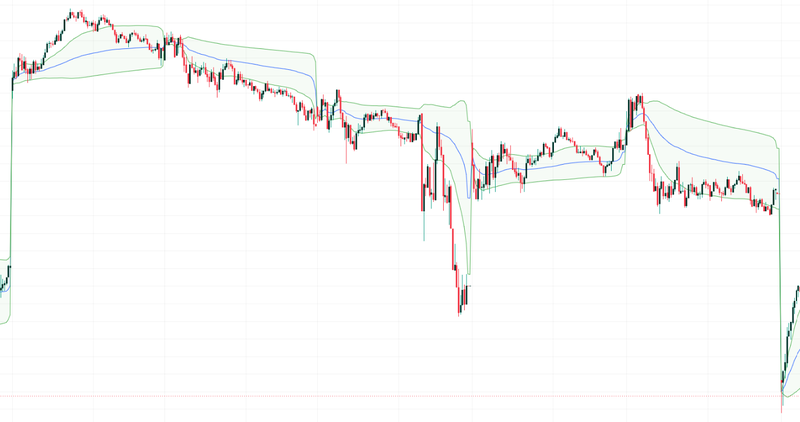
Figure 2. VWAP (Example). Source: Figure obtained from TradingView.
Combining VWAP with other indicators and managing risk
Confirmation tools: MA, RSI, MACD, pivot points
To mitigate the statistical probability of entering premature breakout traps or liquidity hunts, professional operators combine the VWAP with complementary technical indicators to fortify their directional execution signals. The most prevalent combinations include:
- Alignment with Moving Averages: This methodology involves executing a trade only when the immediate VWAP signal aligns with the structural trend dictated by longer-term moving averages. By ensuring the intraday volume-weighted bias matches the macro trend, the trader avoids taking counter-trend entries.
- Combination with the Relative Strength Index (RSI): This approach looks for specific trade setups where the market price executes a structural retracement back to the VWAP line precisely as the RSI prints an extreme overbought or oversold reading, thereby increasing the confluence and probability of a successful reversal.
- Combination with the Moving Average Convergence Divergence (MACD): This convergence strategy requires identifying an active MACD momentum crossover (bullish or bearish) occurring in tandem with a clean price bounce or rejection from the VWAP line, confirming that directional momentum is backing the volume-weighted signal.
- Combination with Pivot Points: Because the VWAP is fundamentally an intra-session tool, classical floor pivot points provide excellent structural complements by projecting fixed support and resistance target levels for the immediate session.
Risk management: Entries, stops, targets, and position sizing
Rigorous risk management protocols remain paramount to long-term profitability, irrespective of the technical accuracy of the VWAP setup. The following operational factors form the bedrock of disciplined risk practices:
- Position Sizing: This risk mitigation tool is critically essential when trading financial instruments that incorporate leverage. Correctly calibrating the position size allows the trader to determine, prior to order routing, the exact maximum capital loss that will be sustained if the market invalidates the setup.
- Volatility-Adapted Stop-Loss Placement: Because the VWAP accounts for volume, and the highest volume regimes typically manifest during the volatile opening and closing bells, traders must account for intra-session volatility spikes. Incorporating volatility metrics like the Average True Range (ATR) allows for the intelligent placement of stop-losses, preventing premature shaking out due to normal price noise.
- Risk-Benefit Ratio Structure: Utilizing the standard deviation bands of the VWAP allows traders to mathematically project optimal profit targets while maintaining an asymmetric Risk-to-Reward (R:R) ratio. When combined with broader technical analysis, these statistical boundaries ensure that entries are only executed when the potential upside significantly outweighs the defined capital risk.
Conclusion
Mastering the VWAP indicator fundamentally enhances the way price action is interpreted, integrating the vital institutional dimension of volume into traditional technical analysis. By acting as a dynamic support and resistance zone anchored to actual market liquidity, it provides traders with a legitimate statistical edge in identifying high-probability execution areas. However, its ultimate efficacy depends on it not being used in isolation; combining the VWAP with confirmation oscillators like the RSI, alongside precise position-sizing models, is what ultimately safeguards capital and ensures long-term professional consistency.
If you're interested in trading indices, foreign exchange, shares, or commodities, consider exploring the CFD contracts offered by Equiti Group. Please note that trading leveraged derivatives involves a high level of risk and may not be suitable for all investors.
FAQs
What is VWAP and how is it different from traditional moving averages?
The VWAP (Volume-Weighted Average Price) is a technical indicator that maps price behaviour by allocating greater mathematical weight to price levels that contain the highest traded volume. Unlike standard moving averages, which evaluate closing prices uniformly regardless of volume, the VWAP directly embeds institutional liquidity into its output. Furthermore, the VWAP resets to zero at the start of each trading day for intraday focus, whereas traditional moving averages run continuously across customizable time horizons to map the asset's macro trend.
Why do institutional traders use the VWAP indicator in their trading?
Institutional participants utilise the VWAP because they must execute substantial commercial orders in staggered blocks without causing adverse price slippage. Because the VWAP mathematically represents the "fair price" of a session via volume weighting, buyers focus on buying below the VWAP line, while sellers look to sell above it. This protocol allows firms to source adequate liquidity efficiently and optimise their average fill prices.
How is market sentiment interpreted through the VWAP and its bands?
When price action trades sustainably above the VWAP line, the market exhibits an intraday bullish bias and strong buying pressure. Conversely, prices holding below the VWAP reflect structural weakness and a bearish bias. Meanwhile, the associated standard deviation bands measure the statistical dispersion and implied volatility of the session, allowing traders to systematically identify overextended market moves ripe for potential mean reversion or exhaustion.
What other technical tools is it recommended to combine VWAP with to manage risk?
To avoid false breakouts and liquidity traps, traders frequently couple the VWAP with moving averages for trend alignment, the RSI for overextended exhaustion signals, the MACD for momentum confirmation, and Pivot Points for clear intraday target mapping. For comprehensive risk control, the tool is paired with precise position-sizing methods and volatility metrics like the ATR to ensure stop-losses are placed outside of implied market noise.


