Help
Help NDOG and NWOG in ICT: how to trade new day and new week opening gaps
NDOG and NWOG are ICT trading concepts used to identify price gaps between the closing and reopening of daily and weekly trading sessions. Traders use these levels to assess potential support and resistance, identify price magnets and establish intraday or weekly directional bias.

A New Day Opening Gap is the price difference between the previous trading session's close and the opening price of the next session.
A New Week Opening Gap is the price difference between the Friday session close and the Sunday evening reopening.
An overlap setup occurs when an NDOG or NWOG aligns with another technical reference, such as a Fair Value Gap.
What is a New Day Opening Gap (NDOG)?
A New Day Opening Gap is the price difference between the previous trading session's close and the opening price of the next session. In the commonly used ICT convention, the reference is the 5:00 PM New York close and the 6:00 PM New York reopening.
When the market reopens at a different price from where it closed, the difference creates an opening gap. Traders mark the gap on their charts and monitor how prices behave around them during the following session.
An NDOG can act as a potential price magnet, meaning traders watch for price to revisit the gap. If price returns, the area may provide a reaction or help reveal whether the market is maintaining its directional bias.
ICT traders commonly monitor daily opening gaps over a short period, often around five trading days. This is a trading convention rather than a fixed expiry rule. An NDOG can remain relevant for longer if price continues to react around it.
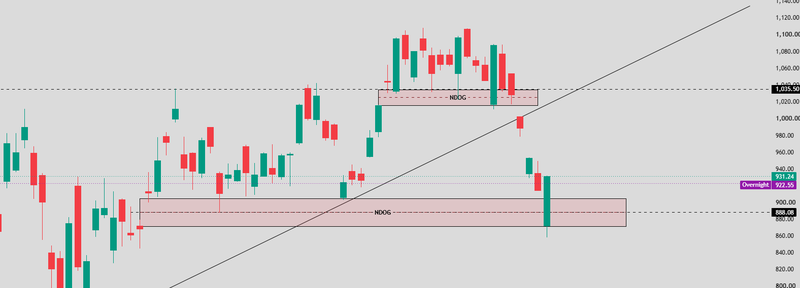
Source: Trading view
What is the New Week Opening Gap (NWOG)?
A New Week Opening Gap is the price difference between the Friday session close and the Sunday evening reopening, using the conventional ICT futures-market reference of 5:00 PM and 6:00 PM New York time, respectively.
The NWOG provides a broader reference for the start of the trading week. Traders use it to assess whether price is above or below the previous week's closing level and to identify areas that may influence price during subsequent sessions.
If the market opens above the Friday close, the gap is upward. If it opens below the Friday close, the gap is downward. However, the direction of the gap alone does not establish whether the market will remain bullish or bearish.
ICT traders often track an NWOG for several weeks, sometimes around five weeks, to monitor whether it continues to influence price. Its relevance depends on subsequent price action, market structure and the broader economic environment rather than a fixed lifespan.
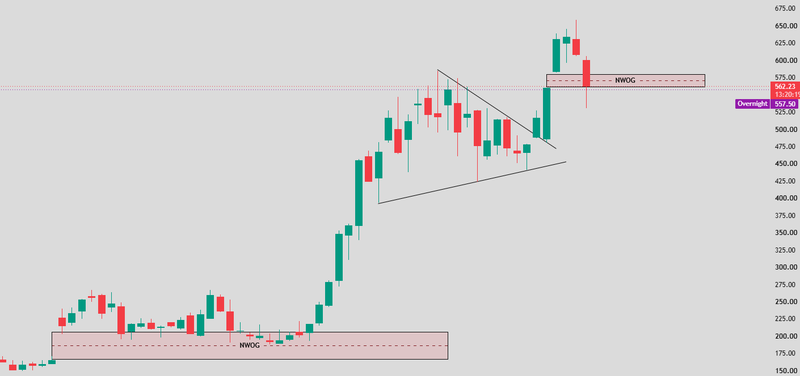
Source: Trading view
NDOG vs. NWOG: What is the difference?
The key difference is the period each gap represents and how traders use it.
An NDOG focuses on the transition between daily trading sessions. It is generally more useful for intraday analysis, helping traders identify potential reaction zones and assess the direction of price during the current session.
An NWOG captures the transition between the previous week and the new trading week. Traders use it to establish broader context, identify potential weekly support and resistance, and assess where price may be traded in relation to the previous week's close.
The two concepts can complement each other
An NWOG can help establish the broader directional context, while an NDOG can provide a more precise reference for an intraday setup. Neither gap should be used as a standalone entry signal.
How do opening gaps work in ICT trading?
Opening gaps are used as reference zones rather than automatic signals to buy or sell. Traders first mark the gap between the relevant closing and opening prices, then observe whether price moves away from it, returns to it or breaks through it.
When price moves away from a gap and later retraces, traders may watch how the market reacts upon returning to the zone. A rejection followed by strong displacement can support continuation interpretation. A clean move through the gap may suggest that the original level is losing its influence.
Some ICT traders also monitor the midpoint of the gap as a reference for price interaction. The midpoint is calculated by averaging the upper and lower boundaries of the gap. It can help organise the analysis, but it does not guarantee that prices will rise or continue from that level.
The important distinction is between identifying a gap and confirming a trade. The gap defines an area of interest. Market structure, liquidity and the reaction in that area help determine whether a potential setup is developing.
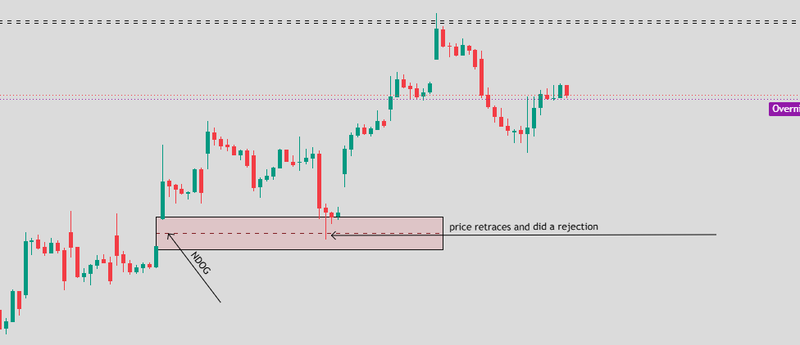
Source: Trading view
The overlap setup: Trading high-confluence zones
An overlap setup occurs when an NDOG or NWOG aligns with another technical reference, such as a Fair Value Gap (FVG), an order block or a previous liquidity level. When several independent signals point to the same price area, traders may consider that zone more significant.
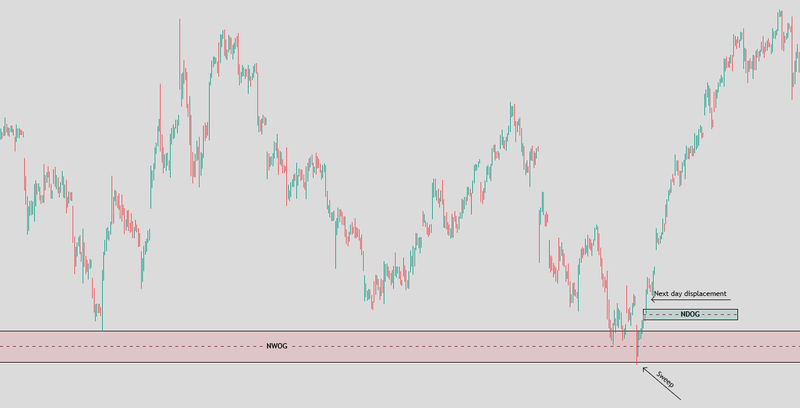
For example, suppose an NWOG sits near a bullish order block, and price sweeps a previous low before moving higher with strong displacement. If a daily opening gap also overlaps the same area, the combined evidence may support a potential bullish setup.
The bearish version follows the opposite logic. If price approaches an overlapping gap and bearish order block, sweeps liquidity above a previous high and then moves lower with clear displacement, traders may watch for a short opportunity.
The overlap itself is not confirmation. Several ICT levels can cluster together without producing a meaningful reaction. Traders still need to assess the broader trend, the location of liquidity, the quality of the displacement and whether the setup offers a reasonable risk-to-reward profile.
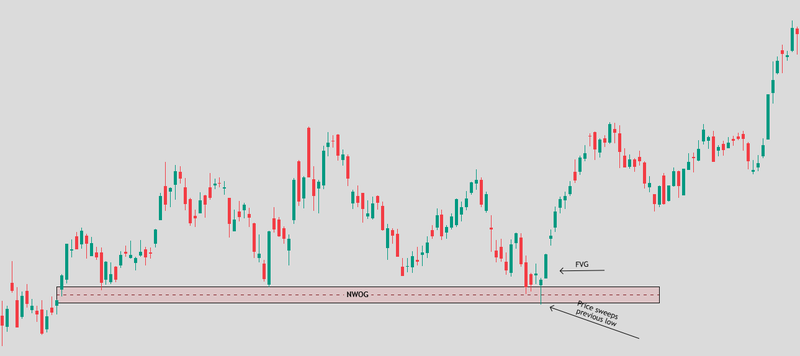
Source: Trading view
How to use NDOG and NWOG in a trading plan
Start by establishing a broader market context. Review the higher-timeframe structure and mark the current NWOG to identify where price sits relative to the previous week's close. This can help frame the weekly analysis, but it should not determine directional bias on its own.
Next, mark the relevant NDOG for the current trading day. Observe whether price is trading above or below the gap, whether it is moving towards the zone and whether previous price action suggests that the level remains relevant.
If price approaches an opening gap, look for confirmation rather than entering automatically. A liquidity sweep, market structure shift, displacement or an FVG may provide additional evidence of a potential move. The combination should fit the broader market structure rather than contradict it without a clear reason.
Before entering, define the invalidation level and profit target. A stop-loss may be placed beyond the structural level that would invalidate the setup, while a target may be based on opposing liquidity or another predefined price objective.
Source: Trading view
Risks of trading NDOG and NWOG
Opening gaps are reference points, not guaranteed reversal zones. Price may fill a gap immediately, leave it untouched or move through it without a significant reaction. Treating every gap as a price magnet can lead to premature entries and repeated losses.
Another risk is confusing correlation with confirmation. An NDOG overlapping with an order block and an FVG may appear compelling, but the combination does not guarantee that buyers or sellers will defend the area. Each signal must be evaluated in the context of actual price action.
Session timing also matters
The 5:00 PM and 6:00 PM New York references follow a common ICT futures-market convention. Trading hours and chart construction differ across futures, forex and other markets, and daylight-saving changes can affect the corresponding time in other regions. Traders should use consistent session settings when marking gaps.
Finally, opening gaps can be affected by major economic releases, unexpected news, changes in liquidity and shifts in market sentiment. Risk should be defined before entry, and position size should reflect the distance to the invalidation level.
FAQs
What is NDOG in ICT trading?
NDOG stands for New Day Opening Gap. It is the price difference between the previous daily session's close and the next session's open, commonly marked using the 5:00 PM and 6:00 PM New York time references in ICT trading.
What is NWOG in ICT trading?
NWOG stands for New Week Opening Gap. It is the price difference between the Friday session close and the Sunday evening reopening. ICT traders use it to assess weekly price positioning and identify potential support and resistance zones.
What is the difference between NDOG and NWOG?
NDOG is primarily used for intraday analysis, while NWOG provides a broader weekly reference. Both can help traders identify potential price reaction zones, but they cover different trading session transitions.
How do you trade an NDOG?
Traders mark the daily opening gap and monitor how price behaves around it. They may look for confirmation from a liquidity sweep, market structure shift, displacement or Fair Value Gap before considering an entry.
How do you use an NWOG to determine weekly bias?
Traders compare the current price with the NWOG and examine the broader market structure. Trading above or below the gap provides context, but the gap's direction alone does not confirm a bullish or bearish weekly bias.