Help
Help 
What is the difference between OTE vs Fibonacci
Optimal Trade Entry (OTE) is a specialized subset of the classic Fibonacci retracement tool, focusing strictly on a deep 61.8% to 79% pullback zone. While a standard Fibonacci tool monitors multiple generic levels (such as 23.6%, 38.2%, 50%, and 61.8%) across random price swings, OTE represents a rigid institutional trading model. Popularized by ICT, OTE requires a strict market structure context rather than raw technical speculation.
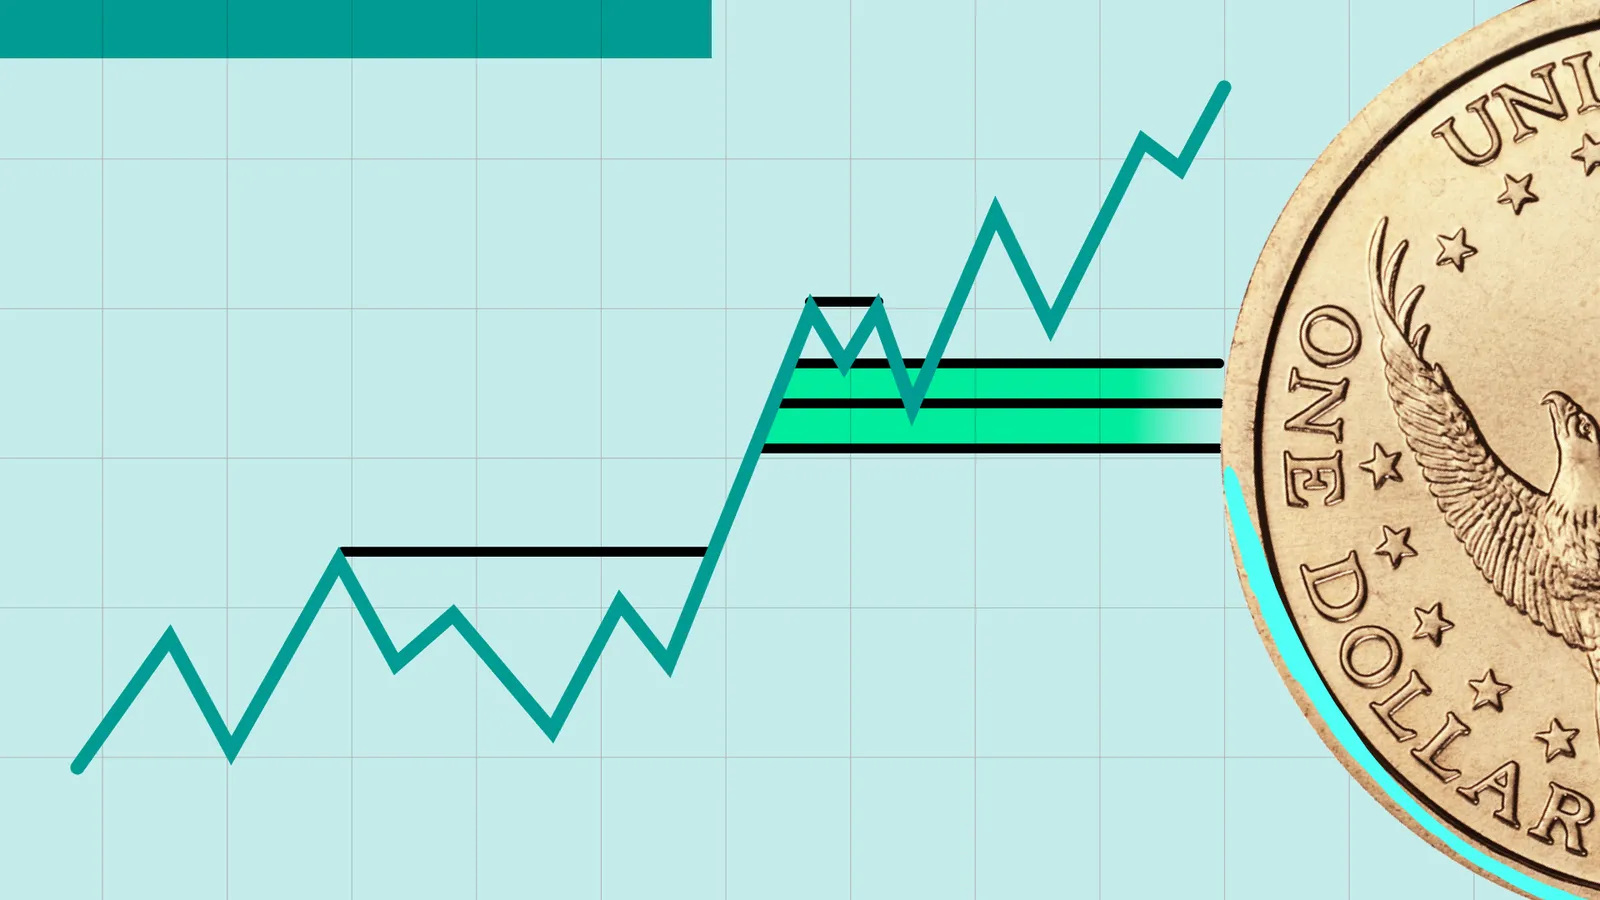
OTE is an ICT refinement of the Fibonacci retracement tool.
The OTE zone sits between 61.8% and 79.0%, with 70.5% considered the sweet spot.
The setup works only after a Market Structure Shift or Break of Structure.
Institutions look for discount and premium pricing before entering.
OTE becomes stronger when combined with Fair Value Gaps, Order Blocks, and displacement.
Why do retail traders often enter too early
One of the biggest mistakes beginners make is treating every Fibonacci retracement as a buying or selling signal.
Imagine a market breaks higher with strong momentum. Many traders immediately draw Fibonacci and buy the first pullback around 38.2% because they fear missing the trend.
The problem is that healthy trends often retrace much deeper
Price may continue falling through 38.2%, pause around 50%, and only reverse after reaching the deeper institutional retracement zone.
The result is familiar. Early buyers get stopped out, while patient traders enter later with better prices and smaller risk.
What is Fibonacci retracement?
The Fibonacci retracement tool comes from the famous Fibonacci sequence, where each number builds from the two before it.
From this sequence, several mathematical ratios emerge that traders have used for decades, including 38.2%, 50%, and 61.8%. These levels are commonly used to estimate where a trend might pause before continuing.
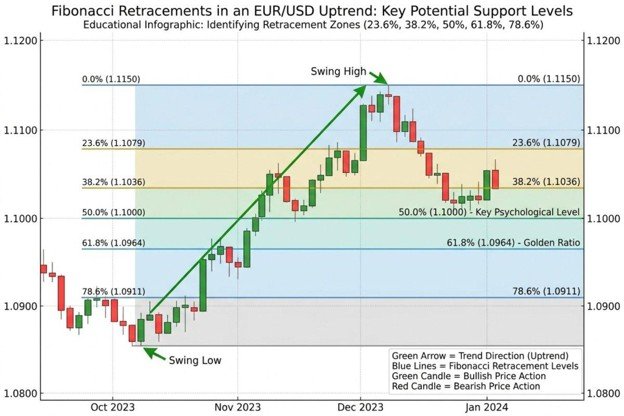
Source: CHATGPT – Authors idea
The problem with classic Fibonacci
The biggest weakness of traditional Fibonacci is not mathematics. It is decision-making
When price approaches the retracement, traders suddenly have several possible entry levels. Should the trade happen at 23.6%? What about 38.2%? Should they wait for 50%? Or is 61.8% the real level?
Instead of creating clarity, the tool often creates analysis paralysis
The market eventually reacts somewhere, but choosing the correct level beforehand becomes much harder. ICT's solution is to stop treating every Fibonacci level equally.
The institutional shift: What is Optimal Trade Entry (OTE)?
OTE is ICT's focused interpretation of Fibonacci. Instead of looking across the entire retracement, traders concentrate on a narrow institutional entry zone where price has already offered a meaningful discount during a bullish trend or a meaningful premium during a bearish trend.
The setup assumes that institutions prefer entering after liquidity has been collected rather than paying the first available price. That is why OTE usually appears after displacement, not before it.
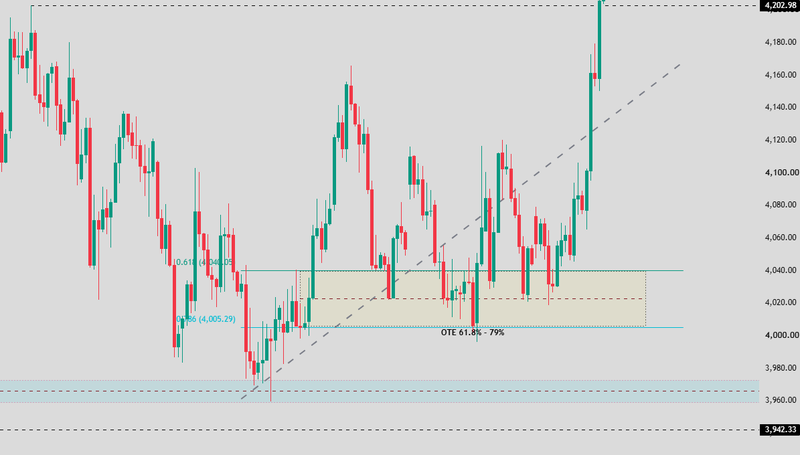
Source: Trading view
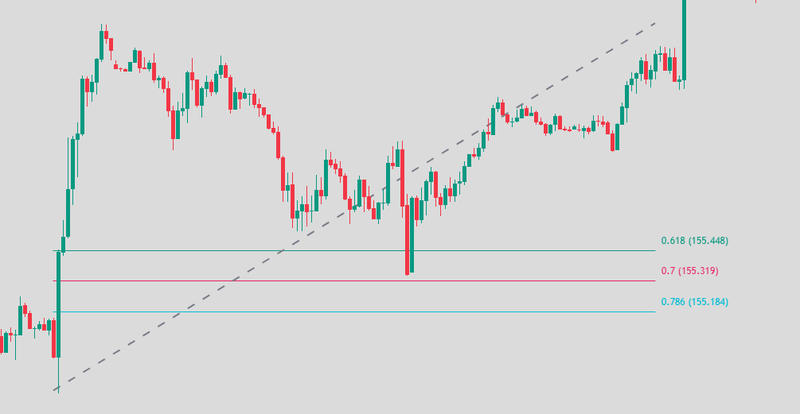
The OTE levels
The OTE model revolves around three specific Fibonacci levels.
61.8%: The gatekeeper
The 61.8% level acts as the entry threshold. Once price reaches this area, the retracement becomes deep enough for many ICT traders to begin paying attention. It is not automatically the entry. It is the point where the institutional zone begins.
70.5%: The sweet spot
70.5% level is considered the heart of the OTE. Many traders view it as the most balanced area inside the retracement because price has already corrected deeply without destroying the trend. This is why the 70.5% level is often called the Optimal Trade Entry itself.
79.0%: The last line of defence
The 79.0% level represents the deepest acceptable retracement before the setup becomes much weaker. If prices are pushed significantly beyond this level, traders begin questioning whether the original trend still has control. Rather than chasing every deep pullback, OTE defines a clear boundary where the trade idea remains valid.
Source: Trading view
Discount vs. premium pricing
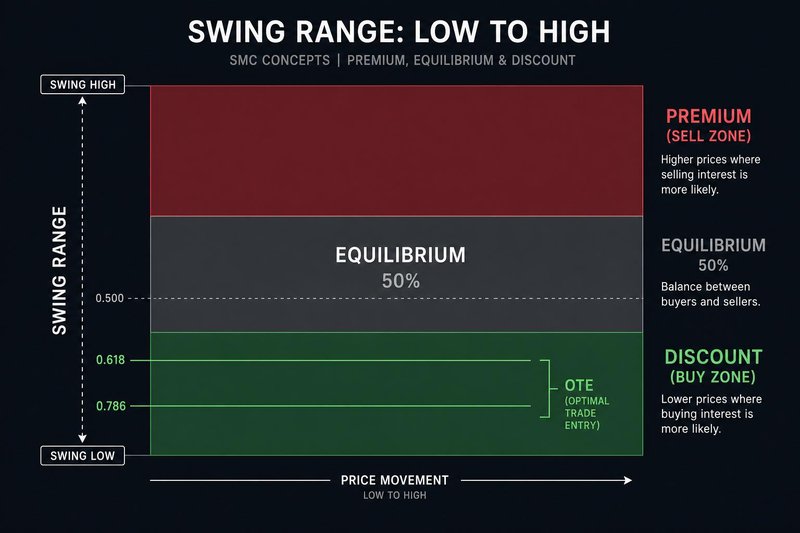
One of the biggest differences between ICT and traditional Fibonacci is the idea of discount and premium pricing. Instead of asking whether price has simply pulled back, ICT asks whether price has returned to a wholesale price. In a bullish trend, everything below the 50% equilibrium becomes discount territory.
That is where buyers prefer looking for opportunities
In a bearish trend, everything above the 50% equilibrium becomes premium territory, where sellers become more interested.
Source: MQL5
How to draw OTE correctly
The biggest mistake traders make is drawing OTE on random price swings. The setup requires context first.
Wait for the catalyst
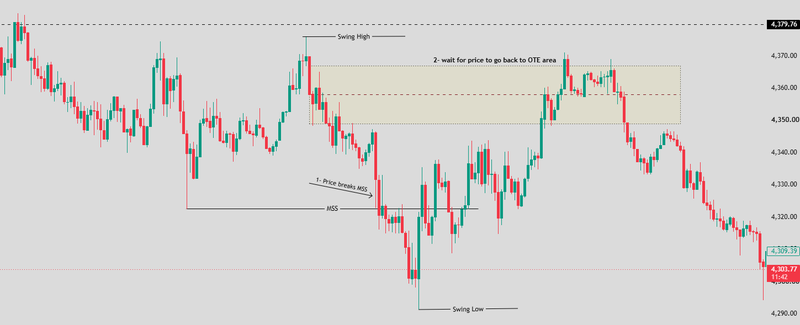
OTE begins only after the market has already confirmed directional intent. That confirmation usually comes through a Market Structure Shift (MSS) or a Break of Structure (BOS) accompanied by aggressive displacement.
The displacement matters because it shows that one side has taken control of the market. Without displacement, the retracement has no meaningful impulse to measure.
Place the Fibonacci anchors correctly
Once the displacement has occurred, the Fibonacci tool should be anchored to the move that created the structural break.
For a bullish setup, draw from the absolute swing low to the swing high that caused the Break of Structure. For a bearish setup, draw from the absolute swing high to the swing low that created the bearish structural break. This anchor placement keeps the OTE tied to the market's real institutional impulse rather than a random price swing.
Source: Trading view
Combining OTE with ICT confirmation
The strongest OTE setups rarely rely on Fibonacci alone. Many ICT traders wait for price to enter the OTE zone while also interacting with a Fair Value Gap left behind during displacement.
An Order Block inside the same retracement area adds another layer of confirmation. If a lower-timeframe Market Structure Shift appears after price enters the OTE zone, the setup becomes much stronger than relying on Fibonacci alone.
The goal is not to stack indicators; the goal is to let multiple pieces of institutional-style price action tell the same story.
Risks of the OTE strategy
The biggest misconception is believing every retracement into 70.5% will be reversed. OTE is a context-driven model, not a magic Fibonacci number.
One common mistake is drawing the tool before the market has confirmed direction. Without a genuine Market Structure Shift or Break of Structure, the retracement often measures a move that has no institutional significance.
Another risk comes from forcing OTE onto every price swing. The setup works best when measuring the impulse that created displacement, not every small fluctuation on the chart.
News events also create additional uncertainty. During high impact releases such as CPI, Non-Farm Payrolls, or central bank decisions, price can move through the OTE zone without respecting normal technical behaviour.
The safest approach is to treat OTE as an institutional entry framework built on confirmed structure, not as a standalone Fibonacci signal.
FAQs
What is OTE in ICT trading?
OTE, or Optimal Trade Entry, is an ICT trading concept that uses a deep Fibonacci retracement zone between 61.8% and 79.0% to identify higher-probability entries after a confirmed Market Structure Shift or Break of Structure.
What is the OTE Fibonacci zone?
The OTE zone spans 61.8%, 70.5%, and 79.0% of a Fibonacci retracement. The 70.5% level is widely considered the sweet spot where institutions may look for discount or premium pricing before continuing the trend.
What does the 70.5% Fibonacci level mean?
The 70.5% level is the midpoint of the OTE zone. ICT traders often view it as the most balanced area for a retracement because price has corrected deeply enough to offer a better entry without necessarily invalidating the trend.
Is OTE better than the standard Fibonacci retracement?
OTE is not a replacement for the classic Fibonacci tool. It is a more specialised approach that focuses only on the deeper retracement zone after the market has already confirmed directional intent through displacement and a structural break.
What is the difference between OTE and traditional Fibonacci?
Traditional Fibonacci treats multiple levels such as 23.6%, 38.2%, 50%, and 61.8% as potential reaction zones. OTE narrows the focus to the 61.8%-79.0% range, reducing uncertainty and concentrating on institutional-style entries.