
 Help
Help 
Trading Ideas
Get the edge with potential investments and opportunities
What does 'Buy the dip' mean?
“Buy the dip” means entering a market after an asset has fallen in price, with the expectation that it will recover. The strategy can work during temporary pullbacks, but it carries risk if the fall becomes a deeper decline.

Order Block vs Breaker Block vs Mitigation Block explained
Order blocks, breaker blocks and mitigation blocks help traders read different stages of market structure. One shows the origin of an impulse, one reflects a failed zone after reversal and one forms after a failed push and smaller structural shift.

What is consolidation in trading?
Consolidation is a market phase where price stops trending and moves sideways within a defined range. It usually forms between support and resistance, as momentum slows and buyers and sellers reach a temporary balance.
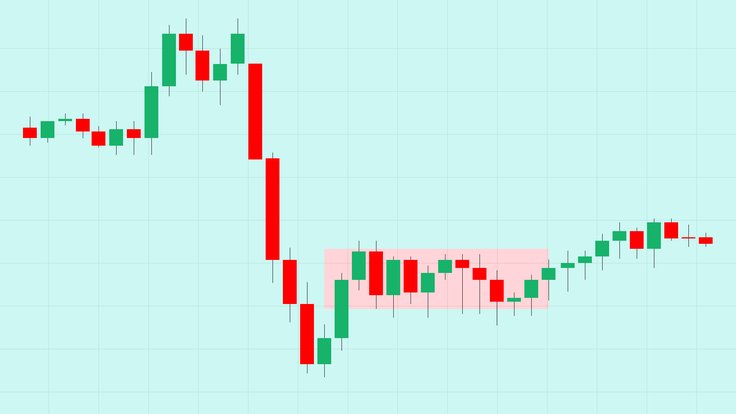
SMC entry model explained: how to find high-probability trade entries
SMC entry models are used to identify trade entries by tracking where institutional activity may be influencing price. They focus on liquidity, structure shifts and imbalances rather than standard retail indicators.
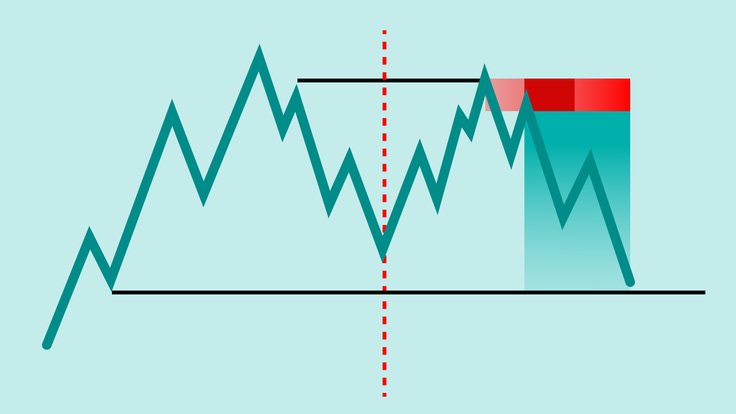
ICT Killzones explained: why London and New York sessions matter to traders
ICT Killzones are specific trading windows when market activity, liquidity and volatility often increase. They are not buy or sell signals, but periods when price is more likely to make meaningful moves as banks, institutions and professional traders become more active.

Whipsaw meaning in trading: Definition and examples
A whipsaw is a sharp price reversal that follows a false breakout, often driven by low liquidity, higher volatility or liquidity sweeps. Traders can manage the risk by using volume filters, multi-timeframe confirmation, Average True Range (ATR)-based stop-losses and clear position sizing.

What is swing trading?
Swing trading aims to capture part of a larger price movement over the short to medium term. Traders use tools such as technical analysis, trend signals, support and resistance, and risk controls to manage positions.

Dot plot guide: How to read Fed rate signals
The Fed dot plot shows the anonymous interest rate projections of 19 Federal Open Market Committee (FOMC) members. Introduced in 2012 to guide market expectations, it helps traders assess future policy direction and wider economic signals.

How is currency valued?
A currency's value is measured by how much it can be exchanged for another currency. In this guide, we'll explain how currencies are valued and the factors that influence exchange rates.

What is copy trading & how to copy expert traders
Copy trading is an investment method that lets you mirror the trades of experienced investors automatically. When the trader you follow opens or closes a position, the action is copied to your account based on the amount you have allocated.
