Volume profile trading: How to read high-volume and low-volume zones
The Volume Profile is a sophisticated technical tool that projects the accumulation of executed transactions at specific price levels. By identifying key structural zones such as the Point of Control (POC), Value Areas (VAs), and high- or low-volume nodes, a trader is equipped to discern between areas of market equilibrium (acceptance) and structural inefficiencies (rejection).

The Volume Profile plots transactions directly onto the price axis, revealing exactly where capital was concentrated, as opposed to traditional chronological volume indicators.
The Point of Control (POC) represents the "fair price" level with the highest institutional trading consensus, acting as a powerful structural magnet for price.
High-volume zones (HVNs) act as significant structural supports or resistances where price tends to consolidate, compress, and accumulate orders.
Low-volume nodes (LVNs) signal market inefficiencies or order flow imbalances, often leading to rapid directional expansions or violent price rejections.
What is volume profile?
How volume profile works
The technical functioning of the Volume Profile is based on the cumulative aggregation of financial asset transactions—such as futures contracts, equities, or foreign exchange commitments—executed at specific price levels over a predefined period. Subsequently, this accumulation of transactions is plotted onto the price axis of the asset. This methodology reveals volume distribution profiles where buyers and sellers have agreed on a greater density of transactions, establishing clear areas of market activity.
Volume profile vs traditional volume
The fundamental distinction between the Volume Profile and traditional volume indicators lies in the specific axis chosen for data grouping and projection. While traditional volume analysis aggregates the volume of transactions along the time axis to illustrate chronological behaviour, the Volume Profile reflects transaction density along the price axis. This alternative layout reveals the precise auction distributions where market capital was heavily concentrated.
Common volume profile types (fixed, session, anchored)
The Volume Profile features distinct, highly functional variants designed for specific analytical purposes, among which are the following:
- Fixed Range Volume Profile (FRVP): This variant allows an operator to manually delimit a specific chart area or a distinct set of structural zones on an asset's price chart. It is primarily used to isolate and study consolidation structures or distinct trending impulses.
- Session Volume Profile (SVP): This version automatically calculates and charts an individual profile for each specific trading session. It enables day traders to analyse the intraday balance of institutional order flow and identify critical trading levels that are highly likely to influence subsequent trading sessions.
- Anchored Volume Profile (AVP): This profile is established from a specific historical event or a distinct starting point selected manually by the operator. From this chosen anchor point, the Volume Profile updates continuously in real-time as subsequent trading data accumulates.
Core volume profile levels you should know
Point of control (POC)
The Point of Control (POC) reflects the exact price level where the highest volume of trading activity occurred within a given time interval. Visually, it is identified as the longest horizontal histogram bar within the volume distribution. Consequently, the POC represents the zone of greatest auction consensus between the forces of supply and demand. It consistently serves as a critical area of institutional interest where price tends to mean-revert, as this specific level is classified as a "fair price" zone.
Value area (VA), value area high (VAH), and value area low (VAL)
The Value Area (VA) represents the price range within which the vast majority of the total traded volume was executed during a defined timeframe. Modern financial charting platforms, which provide these technical analysis tools, default to setting the VA at 70%. This convention emulates the 68.2% parameters of a Gaussian normal distribution, representing plus or minus one standard deviation. Therefore, this zone encompasses the price range that the broader market considers "reasonable" for active trading, given the prevailing supply and demand dynamics.
The Value Area High (VAH) represents the upper boundary of the defined Value Area. This level marks the highest quote within the established equilibrium range. Conversely, the Value Area Low (VAL) represents the lower boundary of the Value Area, reflecting the lowest quote accepted within that same parameters. Any decisive price expansion above or below these boundaries signals an active attempt at price discovery. Consequently, the market consensus will either accept these new levels by accumulating volume—thereby establishing a new "fair value"—or it will trigger a violent rejection back toward the core VA zone due to a lack of structural acceptance.
High volume nodes (HVN) and low volume nodes (LVN)
Within the structure of trading volume over a given period, distinct irregularities appear that communicate invaluable data to market participants.
- High Volume Nodes (HVNs): These reflect prominent distribution peaks within the Volume Profile histogram that do not equal or exceed the primary POC. HVN levels represent secondary areas of commercial consensus where price is highly likely to stall and consolidate.
- Low Volume Nodes (LVNs): These identify specific prices where trading activity has been minimal or entirely non-existent. LVNs are routinely accompanied by liquidity gaps, range breakouts, or aggressive directional expansions where the market moves rapidly in search of a "fair price" due to high institutional conviction.
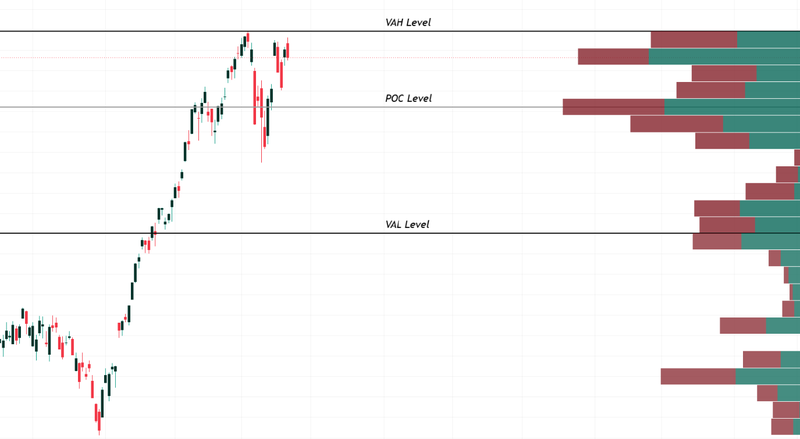
Figure 1. Volume Profile (Example). Source: Own analysis conducted via TradingView.
How to read high-volume and low-volume zones
What high-volume zones signal (acceptance, balance, support/resistance)
High-volume zones, whether defined by a prominent HVN or the primary POC, represent clear areas of structural equilibrium. These profiles indicate what the market consensus considers an appropriate transaction price, implying that a substantial density of resting institutional orders could reside within these parameters. Consequently, high-volume zones act as robust support and resistance structures because price velocity typically moderates and reacts whenever it encounters these heavy distribution levels.
What low-volume zones signal (rejection, breakouts, fast moves)
Low-volume nodes (LVNs) generally expose market inefficiencies characterized by an absolute vacuum of liquidity. As a result, there are three common tactical reactions associated with LVN zones: rejection, breakout extensions, and rapid price expansions. A rejection at an LVN indicates a potential immediate return to the preceding HVN, as market participants reassume the validity of the prior distribution. A breakout implies a swift continuation through the LVN vacuum toward a more distant pool of accumulated liquidity. Meanwhile, a rapid directional move reflects an environment where market consensus cannot find immediate value, thereby accelerating the price discovery process toward unvisited areas.
Best practices: Timeframes, ranges, and confluence
Multi-timeframe volume profile analysis
An essential practice in professional trading involves conducting a Volume Profile analysis from macro to micro perspectives. An analyst typically initiates the process by applying a Volume Profile to daily or weekly candlestick charts to identify major long-term areas of market consensus and locate prospective transition zones. Subsequently, the trader drills down into intraday timeframes—covering entire trading sessions or specific algorithmic fragments—to decipher the immediate structural auction being constructed by institutional participants. This multi-layered approach allows for the placement of orders with a superior degree of structural precision.
Combining volume profile with Price Action and other indicators
Volume Profile analysis becomes exceptionally potent when integrated with established analytical frameworks such as classical Price Action and the Wyckoff Methodology. Due to the structural nature of both Price Action and Wyckoff principles, the Volume Profile serves as a vital confirmatory tool. It allows traders to validate breakout validity, differentiate between true accumulation and distribution setups, and define precise profit targets.
Furthermore, the Volume Profile can be cross-referenced with tools that monitor broader order flow data, such as the Commitments of Traders (COT) report or the Volume Weighted Average Price (VWAP) indicator. This combination amplifies execution accuracy by tracking the distinct footprint left by institutional investors within the price architecture.
Conclusion
The application of Volume Profile analysis fundamentally shifts traditional technical interpretation by mapping authentic market liquidity and exposing the strategic intentions of institutional capital directly onto the price axis. Understanding the structural interplay between zones of acceptance and rejection empowers traders to operate in strict alignment with market equilibrium and commercial consensus. Ultimately, integrating fixed, session, or anchored profiles with pure Price Action provides a robust statistical advantage, allowing for the consistent isolation of high-probability scenarios while preserving capital efficiently.
If you're interested in trading indices, foreign exchange, shares, or commodities, consider exploring the CFD contracts offered by Equiti Group. Please note that trading leveraged derivatives involves a high level of risk and may not be suitable for all investors.
FAQs
How does the Volume Profile work as opposed to traditional volume?
Traditional volume measures the absolute number of contracts or shares traded within a specific block of time, projecting these metrics horizontally along the lower axis of a chart. In contrast, the Volume Profile aggregates and projects those identical transactions vertically onto the price axis. This structural reorientation allows market participants to see exactly which specific quotes buyers and sellers interacted with most aggressively, revealing the internal mechanics of liquidity and the precise levels where institutional capital was deployed.
What do POC and Value Area (VA) mean in a trading strategy?
The Point of Control (POC) identifies the exact price quote where the absolute highest concentration of transaction volume occurred, representing the core "fair price" of market consensus. The Value Area (VA) encompasses the broader price range (typically calibrated to 70% of total volume) where the vast majority of trading took place. Breaching the boundaries of the Value Area (the VAH or VAL limits) triggers an active price discovery phase, where the market will either accept the new quote extension by building volume or reject it violently to return to previous equilibrium parameters.
How are high-volume nodes (HVNs) and low-volume nodes (LVNs) interpreted?
High Volume Nodes (HVNs) appear as secondary peaks within the volume histogram, marking areas of sustained acceptance and structural balance; price frequently treats these levels as solid support or resistance zones where it is prone to consolidate. Conversely, Low Volume Nodes (LVNs) manifest as distinct valleys or vacuums within the volume distribution. LVNs reflect acute structural inefficiencies caused by strong directional conviction, which manifests as rapid range breakouts or gaps. Upon encountering an LVN, price will either accelerate through the zone or suffer a swift rejection back toward the nearest high-volume peak.


