Help
Help 
What is consolidation in trading?
Consolidation is a market phase where price stops trending and moves sideways within a defined range. It usually forms between support and resistance, as momentum slows and buyers and sellers reach a temporary balance.
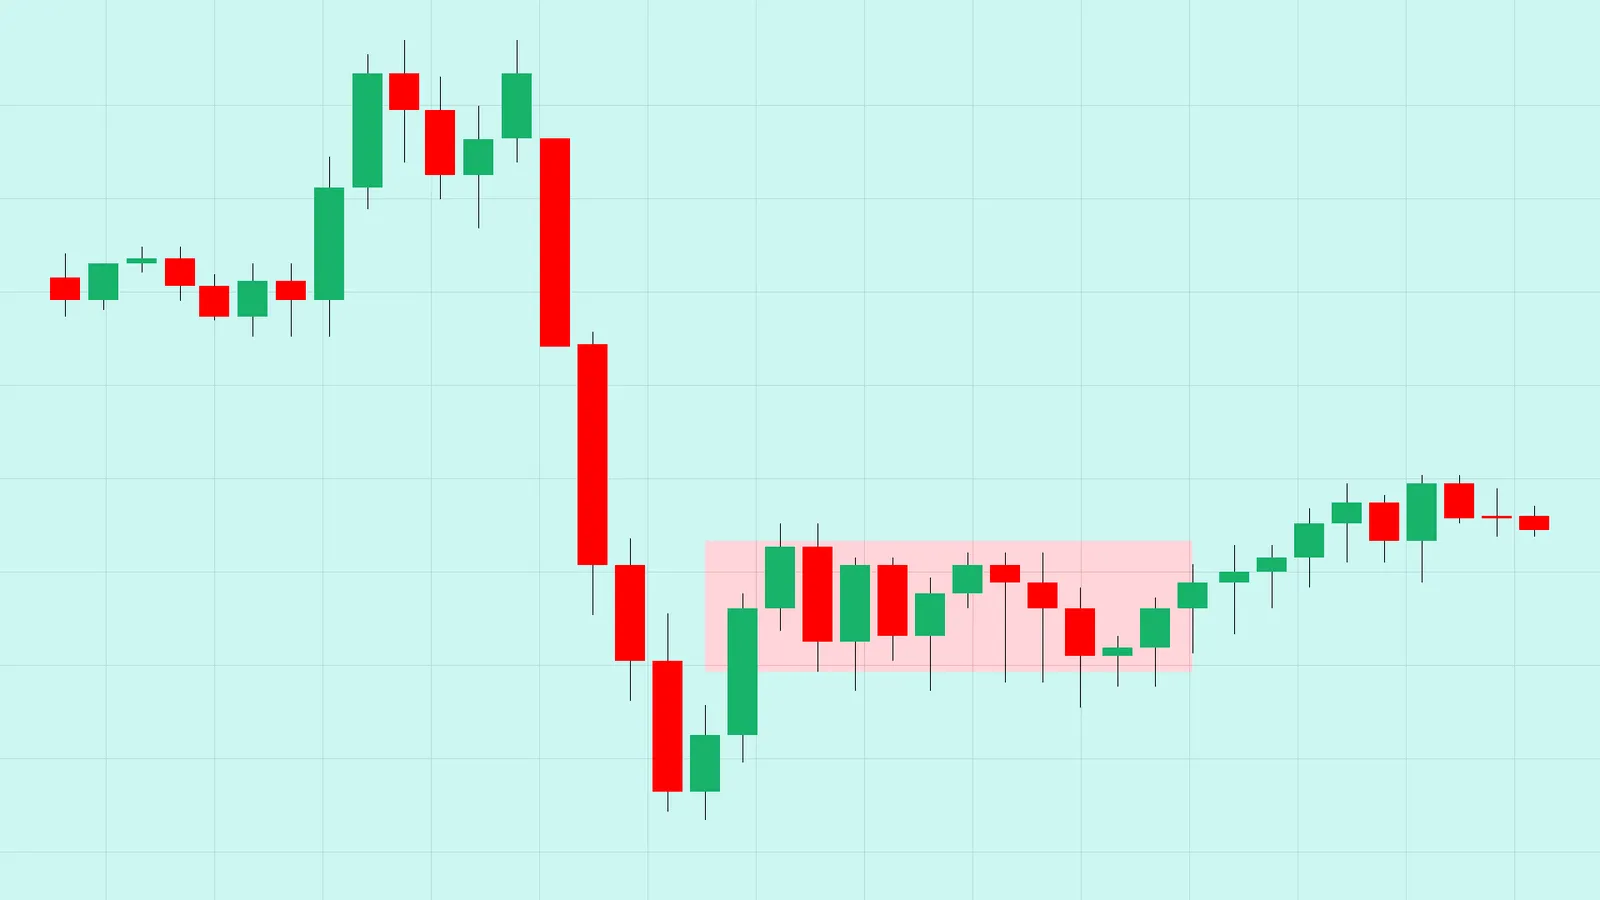
Consolidation is a temporary phase of sideways, range-bound price movement.
It shows a short-term balance between buyers and sellers.
Volatility and trading activity often slow during consolidation.
What is consolidation in trading?
Consolidation is a period when price stops trending and begins moving sideways within a relatively defined range.
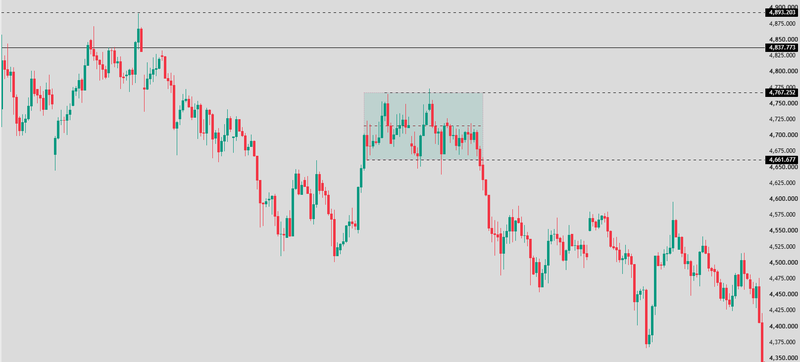
Instead of making a series of higher highs and higher lows, or lower highs and lower lows, the market repeatedly tests similar highs and lows. This creates a temporary equilibrium between buying and selling pressure.
Consolidation does not necessarily mean the trend has ended. In many cases, it is simply the market pausing before continuing in the original direction. Traders often describe this as the market “breathing” after a strong move.
Source: Trading view
How do traders identify consolidation?
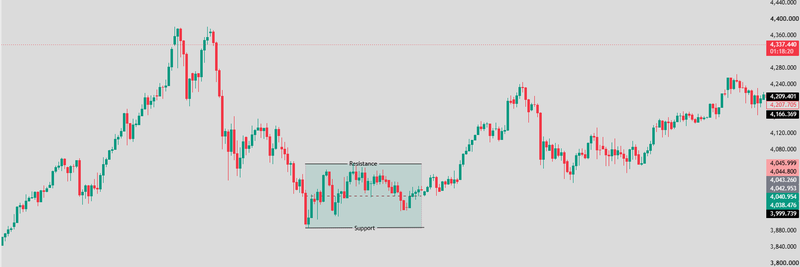
The easiest way to identify consolidation is to look for repeated reactions at similar support and resistance levels. Clear support and resistance boundaries
Price should bounce from roughly the same low area and reject roughly the same high area multiple times. The more times these boundaries are respected, the more meaningful the range becomes.
Source: Trading view
Reduced volatility
Compared with the previous trend, price swings usually become smaller. Candles may shorten, and the market often appears less aggressive.
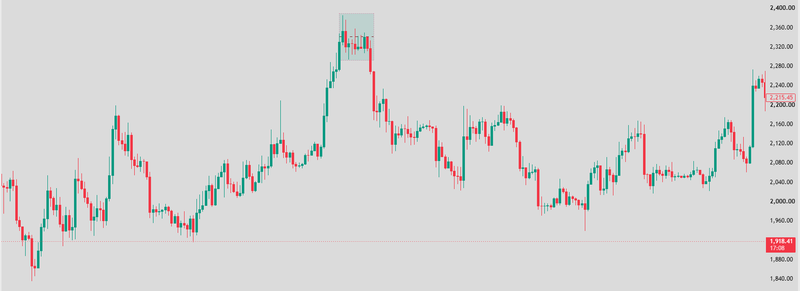
Source: Trading view
Declining volume
In many markets, volume gradually decreases as consolidation develops. This suggests that participation is fading while traders wait for new information or a stronger directional move.
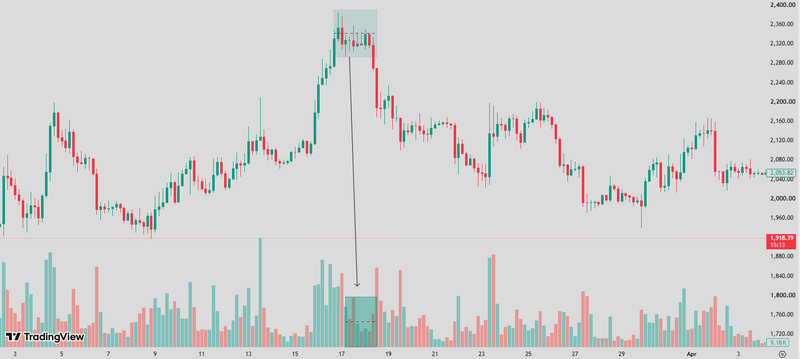
Source: Trading view
Why does consolidation happen?
Consolidation is not random. It usually reflects a change in market behaviour. The market is taking a pause After a strong trend; traders often take profits while new participants hesitate to enter at extended prices. This naturally slows momentum.
Accumulation
In an accumulation phase, larger participants may gradually build long positions without pushing price sharply higher. The market appears flat while buying pressure quietly develops.
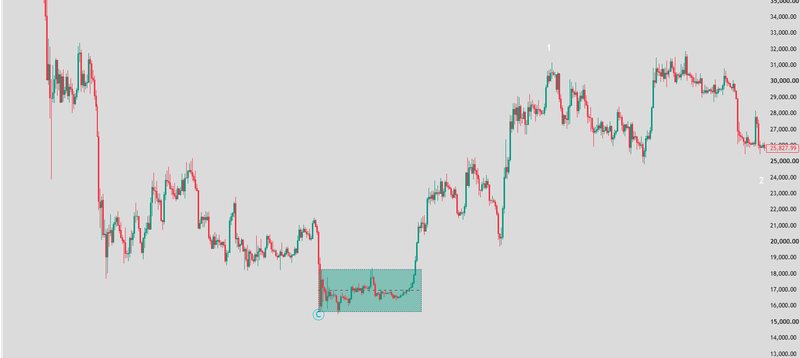
Source: Trading view
Distribution
Distribution is the opposite. Large participants may be reducing long exposure or building short exposure while price remains trapped in a range.
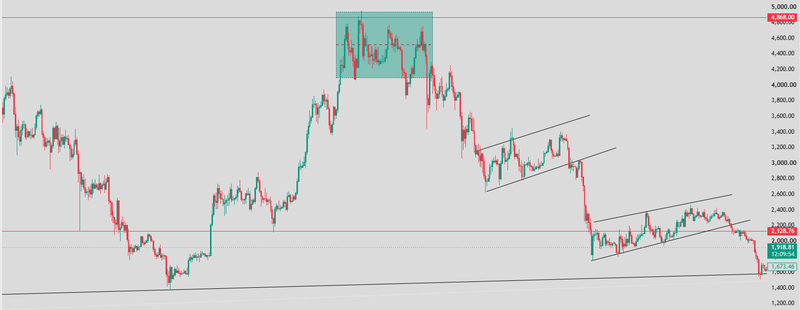
Source: Trading view
Waiting for a catalyst
Markets frequently consolidate before earnings, central bank decisions, inflation reports, employment data, or other major events. Traders become less willing to commit aggressively until the new information is released.
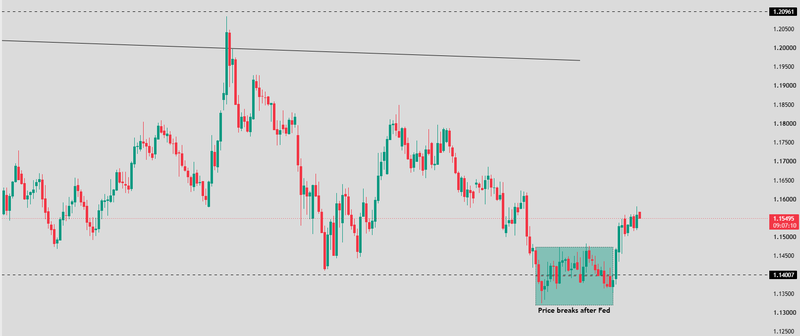
Source: Trading view
The main consolidation patterns
Different consolidation structures can provide clues about market pressure, although no pattern guarantees the breakout direction. A rectangle forms when price repeatedly reacts between horizontal support and horizontal resistance. This is the clearest range pattern and is commonly used for both range trading and breakout trading.

Source: Trading view
Symmetrical triangle
A symmetrical triangle forms when highs become lower and lows become higher, causing price to compress into a narrowing range.
This pattern usually signals that volatility is contracting and a larger move may be approaching, but the breakout can occur in either direction.
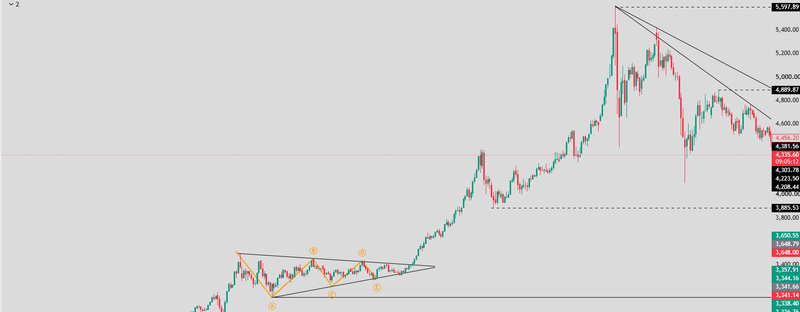
Source: Trading view
A practical workflow for trading consolidation
Instead of reacting emotionally to every move inside a range, it helps to follow a structured process. Identify the range mark the boundaries using at least two or three clear reaction highs and lows. Avoid drawing a range from a single touch.
Decide which strategy fits the market
Ask whether price respects the range cleanly or whether volatility is compressing and preparing for a breakout. Define the risk before entering
A trader buys near support, sells near resistance, and assumes the range will continue holding. The advantage is that entries are usually close to invalidation, which can provide attractive reward-to-risk ratios. The disadvantage is that a genuine breakout can quickly turn a winning range trade into a losing one.
Stop-loss placement for range trades
For a long trade, the stop is usually placed slightly below support. For a short trade, the stop is usually placed slightly above resistance.
The stop should be far enough away to avoid normal noise but close enough that the loss remains controlled if the range fails.
Breakout trading: waiting for confirmation
Breakout traders assume that consolidation is preparing for directional expansion. Instead of trading inside the range, they wait for price to close outside the boundary before considering an entry.
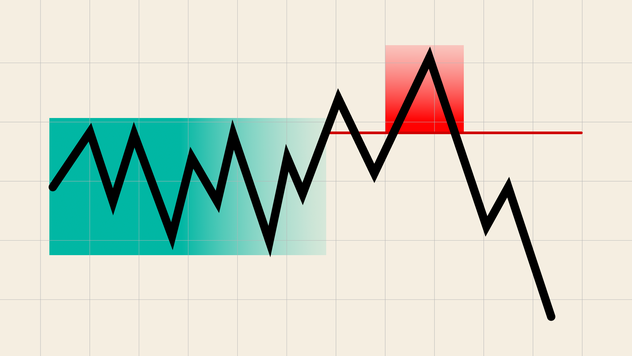
The strongest breakouts usually have several characteristics. Price closes decisively beyond support or resistance rather than briefly trading through it. Volume tends to expand as more participants enter the move, and volatility often increases as momentum builds. Another important clue is the lack of hesitation after the breakout. When price spends little time moving back and forth around the level and continues pushing in the breakout direction, the move is generally considered stronger.
Entering immediately on the first spike can be risky because many false breakouts occur around obvious range boundaries. Waiting for a confirmed close and observing whether the market can hold outside the range often helps reduce the chances of getting trapped in a fake out.
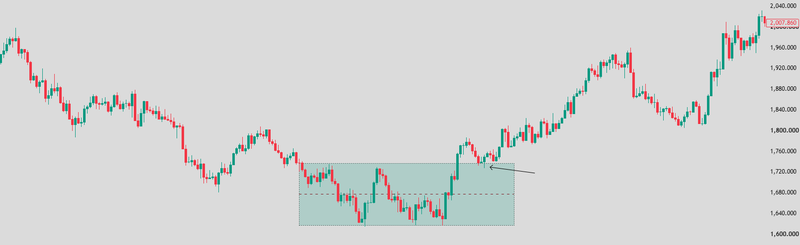
Source: Trading view
Stop-loss placement for breakout trades
For a bullish breakout, the stop is commonly placed back inside the range or below the breakout candle. For a bearish breakout, the stop is placed back inside the range or above the breakdown candle. The goal is to exit quickly if the breakout fails and price returns to the range.
How to manage risk around consolidation
Position sizing becomes especially important in consolidation markets. When trading a tight range, stops are often relatively small. Traders may be tempted to increase size aggressively, but this can become dangerous if a breakout occurs.
A better approach is to keep the dollar risk per trade consistent, regardless of whether the stop is small or large. For breakout trades, remember that volatility often expands after the breakout. A stop that is too tight may be triggered by the normal retest of the range boundary.
FAQs
What is consolidation in trading?
Consolidation is a period when price moves sideways within a defined range instead of trending strongly higher or lower. It reflects a temporary balance between buyers and sellers and often appears before the market makes its next significant move.
Is consolidation bullish or bearish?
Consolidation is neutral by itself. The direction depends on where the breakout occurs and what the broader trend is doing. A consolidation inside an uptrend may lead to continuation, while one inside a downtrend may lead to further weakness.
What is the difference between consolidation and a trend?
In a trend, prices make directional progress through higher highs and higher lows or lower highs and lower lows. In consolidation, price remains trapped between relatively stable boundaries and lacks sustained directional momentum.
What is a false breakout?
A false breakout occurs when price briefly moves outside the range, attracts breakout traders, and then quickly returns inside the range. These fakeouts are one of the biggest risks in consolidation trading.
How do you trade a breakout from consolidation?
Wait for price to close outside the range, look for increased volume and volatility, and avoid entering on the first spike alone. Many traders also wait for a retest of the broken level before entering.