Help
Help Why do bond prices and yields move in opposite directions?
A bond is a loan that can be traded in the market. When a government or company issues a bond, it borrows money from investors. In return, the investor receives interest payments and eventually gets the principal back when the bond matures.
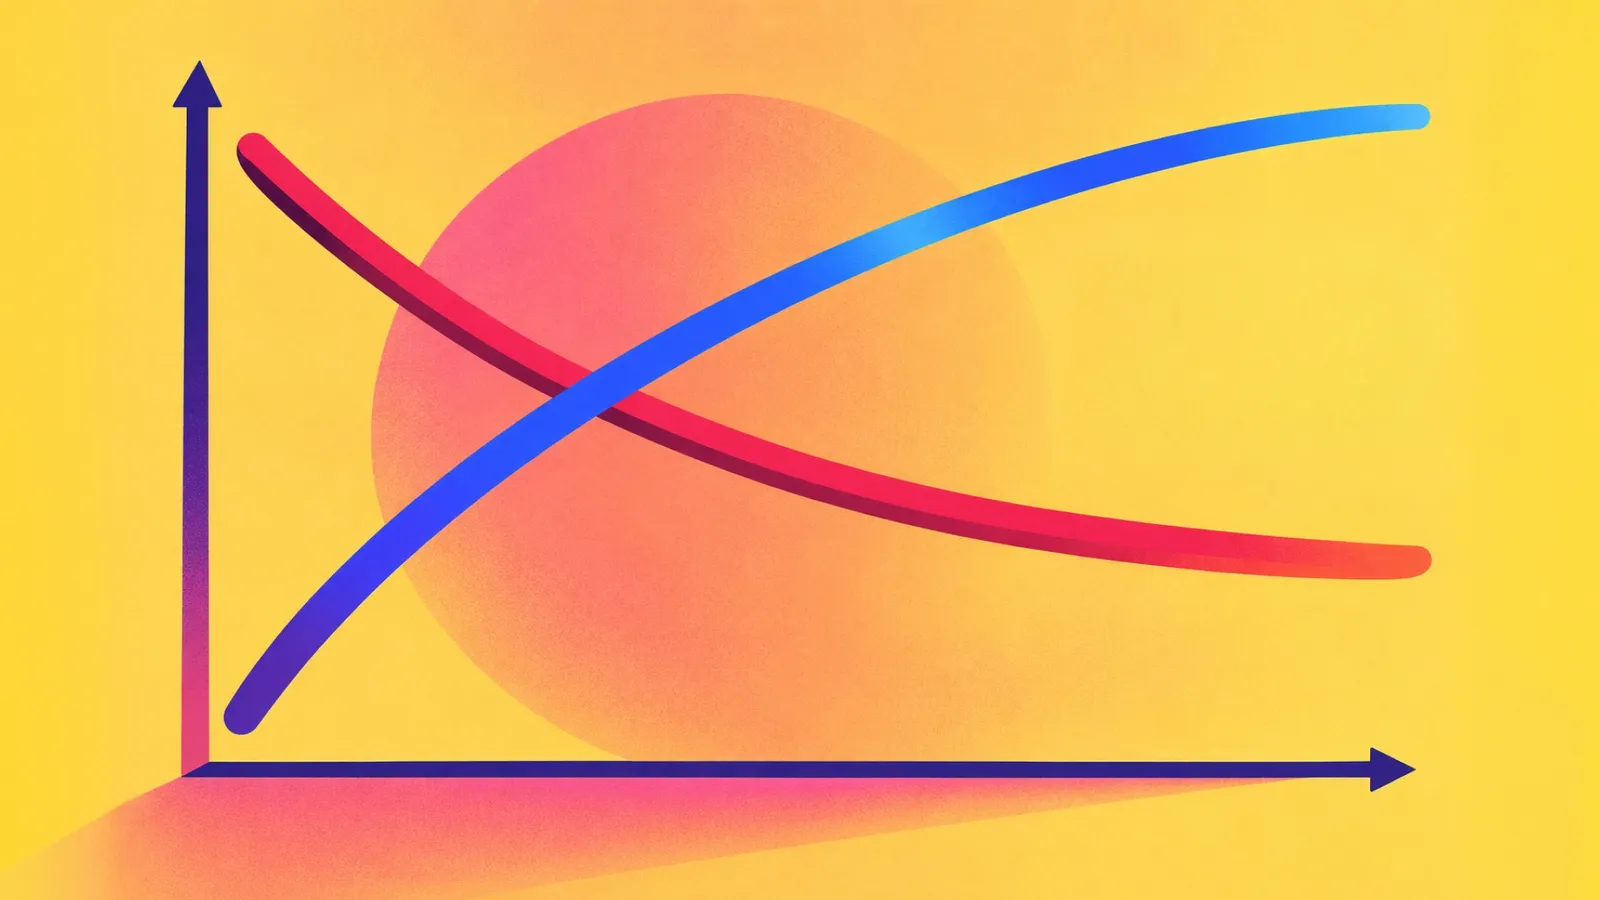
A bond is a debt security issued by a government, company, or other institution to raise money.
Face value, also called par value, is the amount the issuer promises to repay when the bond matures.
Yield curve control is a monetary policy strategy used by central banks to stabilize long-term interest rates by buying or selling government bonds.
Investors may demand higher yields from German Bunds, Japanese Government Bonds and UK Gilts to compensate for the relative return and currency risk.
What is a bond?
A bond is a debt security issued by a government, company, or other institution to raise money. Suppose a government issue a bond with $1,000 face value and a 5% coupon. The investor receives $50 per year in interest.
Assuming the coupon is paid annually, the $1,000 principal is returned at maturity. Once the bond has been issued, however, it does not have to remain with the original investor. It can be bought and sold in the secondary market.
What is a bond's face value?
Face value, also called par value, is the amount the issuer promises to repay when the bond matures. For example, a Treasury bond may have a $1,000 face value.
The market price can trade above or below $1,000 before maturity, but assuming the issuer does not default, the investor receives the face value at maturity.
What is the coupon rate?
The coupon rate is the fixed annual interest rate established when the bond is issued. If a $1,000 bond has a 5% coupon, its annual coupon payment is:
$1,000 × 5% = $50
The important point is that the $50 payment does not suddenly become $60 because market interest rates rise. The bond is effectively locked into the past. Its coupon was determined when it was issued. The market, however, keeps changing.
Coupon rate vs. coupon payment
These two terms are closely related but different. The coupon rate is the percentage. The coupon payment is the actual amount of money paid. A $1,000 bond with a 5% coupon has a 5% coupon rate and a $50 annual coupon payment. If the bond later trades for $900, the issuer still pays $50. If it trades for $1,100, the issuer still pays $50. That fixed payment is what creates the price-yield relationship.
What is a bond yield?
A bond yield represents the return an investor receives from owning the bond at its current market price. The simplest version is the current yield= fixed coupon / price
Consider the $1,000 bond paying $50 per year. If it trades at $1,000: [50/1000 = 5%]
If the price falls to $900: [50/900 = 5.56%]
The coupon has not changed. The price changed. Therefore, the yield changed. This is the basic reason bond prices and yields move in opposite directions.
What is Yield Curve Control?
Yield Curve Control (YCC) is a monetary policy tool where a central bank targets a specific yield on a government bond and uses bond purchases or sales to keep that yield near the target. Unlike traditional interest-rate policy, which mainly controls a short-term policy rate, YCC directly targets a point or section of the yield curve.
If market yields rise above the target, the central bank can buy bonds to push prices higher and yields lower. If yields fall too far, it can reduce purchases or sell bonds. The goal is to keep borrowing costs stable and support economic conditions, although maintaining the target can require substantial intervention in the bond market.
One of the biggest examples is Japan, the BoJ targeted short-term interest rates at -0.1% (negative interest rate policy) and capped the 10-year Japanese Government Bond yield at around 0% through active open-market bond purchases, over time, rising domestic inflation and pressure on the yen forced the BoJ to loosen the strict cap, raising the upper limit to 0.5% and eventually toward 1.0%.
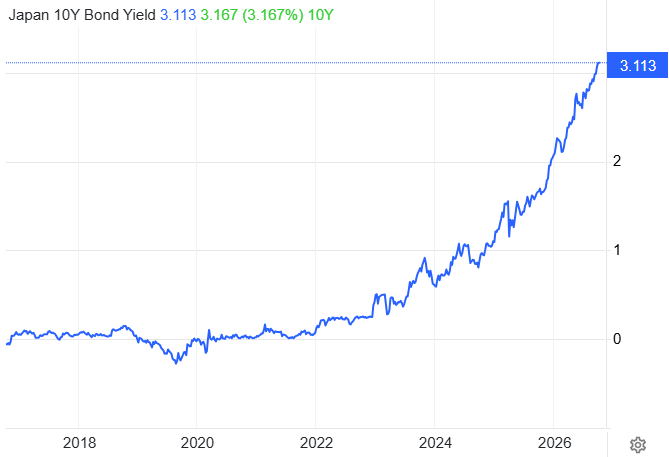
Source: Trading economics
Why do bond prices and yields move in opposite directions?
Imagine that newly issued bonds suddenly offer investors 6%. You own an older bond paying only 5%. Why would someone pay you $1,000 for a bond offering 5% when they can buy a new bond offering 6%?
They would demand a lower price. Perhaps your bond falls to $900. At that lower price, the fixed $50 coupon represents a much higher effective yield for the new buyer.
This is how the existing bond becomes competitive again. The opposite happens when interest rates fall.
If new bonds only offer 4%, your existing 5% bond becomes more attractive. Buyers may bid higher for their price. As the price rises, the effective yield falls. So the relationship is inverse
What is yield to maturity?
Yield to Maturity, or YTM, is more comprehensive than the simple current yield. It estimates the total annualized return an investor would receive if the bond were bought at its current market price and held until maturity, assuming the issuer makes all payments as scheduled and coupons are reinvested according to the calculation's assumptions.
YTM therefore considers not only the coupon payments but also the difference between the purchase price and the face value received at maturity, however, traders often focus on Treasury yields because they reflect changing expectations about inflation, economic growth, monetary policy, and demand for government debt.
What are the drivers of the 2-year, 10-year and 30-year Treasury?
This is where the Treasury curve becomes particularly useful. The three maturities are responding to different parts of the economic story. They are not simply three versions of the same trade.
The 2-year Treasury
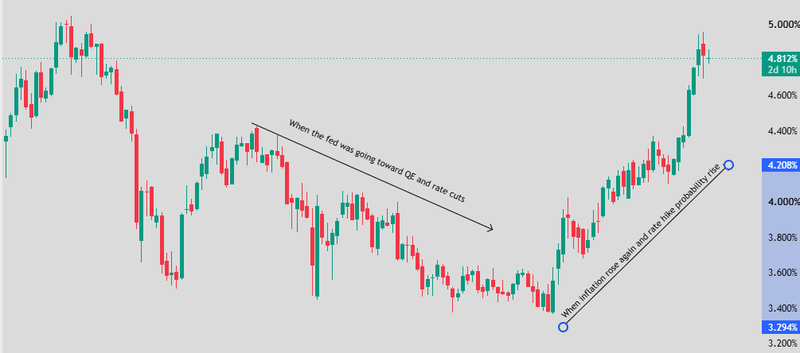
The 2-year yield sits relatively close to monetary policy expectations. It is particularly sensitive to what investors expect the Federal Reserve to do over the next several years. That makes the 2-year period an important market for expectations surrounding:
Fed rate cuts and inflation hikes over the next few years Economic growth the expected path of monetary policy Employment and wage pressures
For example, if inflation proves more persistent than expected, markets may reduce expectations for Fed cuts. The 2-year yield can rise because investors now expect interest rates to remain higher for longer.
If inflation falls sharply and economic growth weakens, markets may price more rate cuts. The 2-year yield can decline. The 2-year therefore tends to be heavily influenced by the expected path of policy, rather than simply today's Fed funds rate.
Source: Trading view
10-year Treasury yield
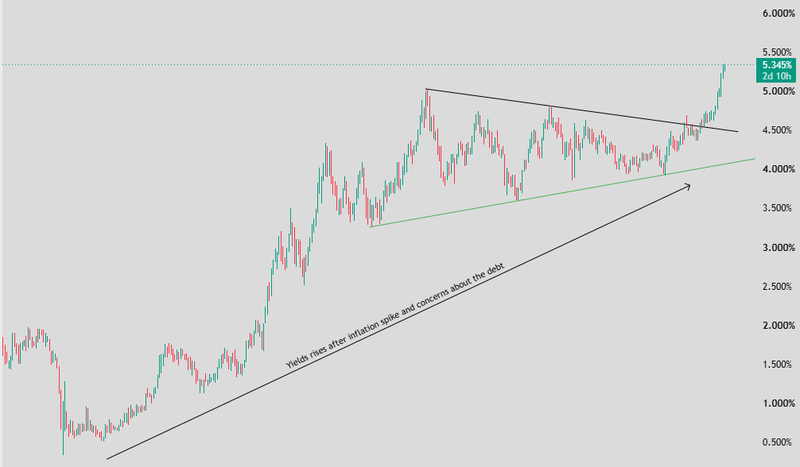
The 10-year Treasury is one of the most important rates in global financial markets. It reflects a much broader combination of expectations. The 10-year is particularly important because it is between short-term monetary policy and long-term economic expectations.
If investors expect stronger growth and persistent inflation, the 10-year yield can rise. If investors expect weaker growth and falling inflation, the 10-year can decline.
But there is another important factor: term premium
Investors may demand additional compensation for holding a long-duration bond because they face uncertainty about inflation, fiscal policy, interest rates, and the future supply of government debt. That can push the 10-year yield higher even when the market expects the Fed to cut rates.
Source: Trading view
30-year Treasury yield?
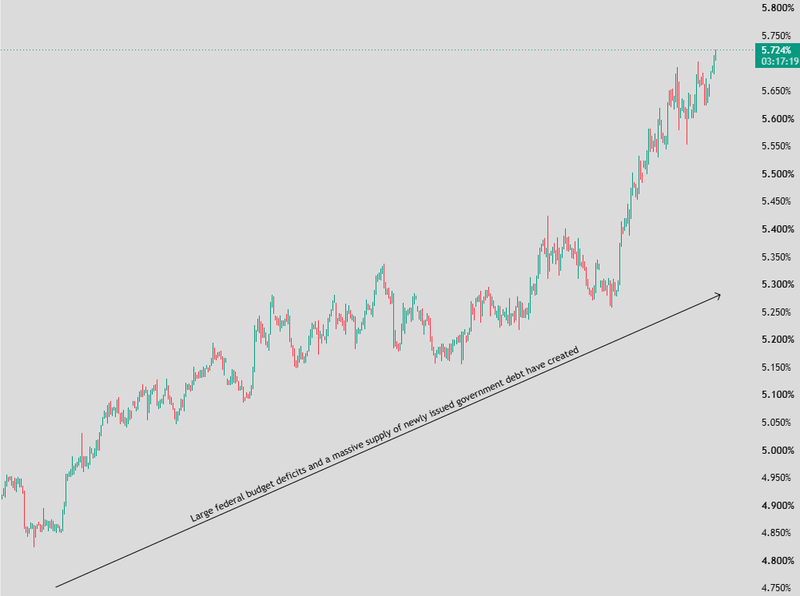
The 30-year Treasury is much more sensitive to the long-term outlook. It is less about what the Fed does at the next meeting and more about what investors think the economic and fiscal environment will look like over decades.
This makes the 30-year period particularly important when markets become concerned about fiscal sustainability. For example, if investors believe government borrowing will remain very large for years, they may demand a higher yield to hold long-duration debt. That can push the 30-year higher even if the Fed is cutting short-term rates.
Source: Trading view
Why the 2-year, 10-year and 30-year can move differently
Imagine the Fed signals several rate cuts. The 2-year yield fell because policy expectations have changed. But at the same time, investors become concerned about government deficits and Treasury supply. The 30-year yield could rise because the long-term risk premium is increasing. The 10-year could move somewhere between the two. That creates a steepening yield curve.
The opposite can happen as well If the market expects the Fed to keep rates high while long-term inflation remains contained, the 2-year may rise more than the 30-year, producing a flatter or inverted curve.
Why traders watch the spread between them
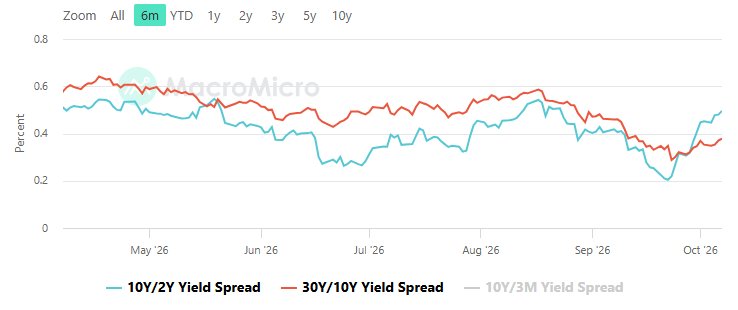
The spread is simply the difference between two Treasury yields. Traders use it because the distance between yields can reveal more than the direction of either yield on its own.
For example, the 2s10s spread measures the difference between the 10-year and 2-year yields, while the 10s30s spread measures the difference between the 30-year and 10-year yields.
Source: MacroMicro
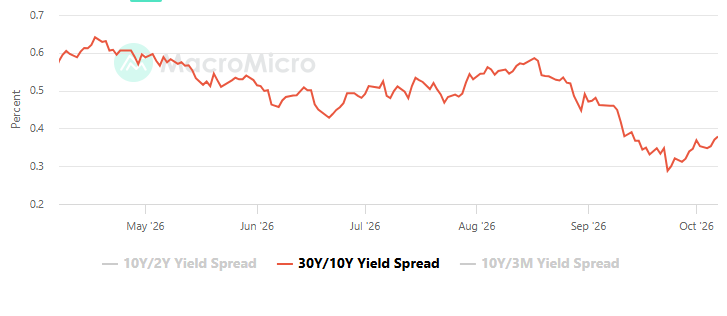
When the spread is tight
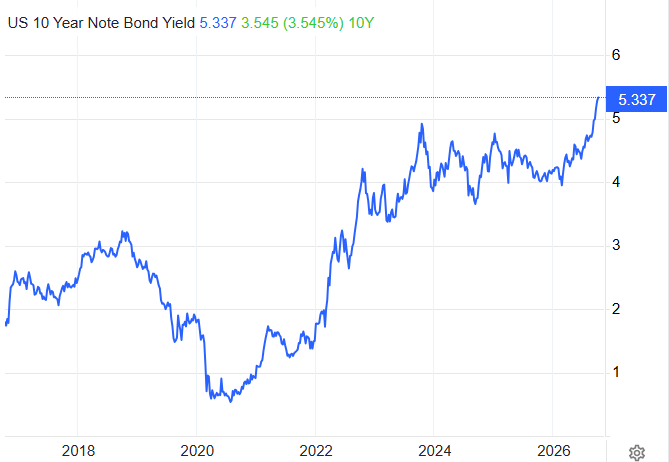
A tight spread means the yields are relatively close together. For example, US 10-year yield is 5.34%, and the 30-year yield is 5.72%, the spread is only 38 basis points. This usually means the market sees relatively little difference between the risks or expected returns associated with those maturities.
Source: MacroMicro
The interpretation depends on the economic environment
A tight 2s10s spread can indicate that markets see the Fed's expected policy path and longer-term economic outlook as relatively aligned. If the spread becomes very flat while short-term yields remain high, it can also suggest that investors expect restrictive monetary policy to weigh on future growth and inflation.
The same principle applies to the 10s30s spread. If the 10-year and 30-year yields are close together, the market may not be demanding much additional compensation for extending duration from 10 to 30 years.
When the spread becomes wide
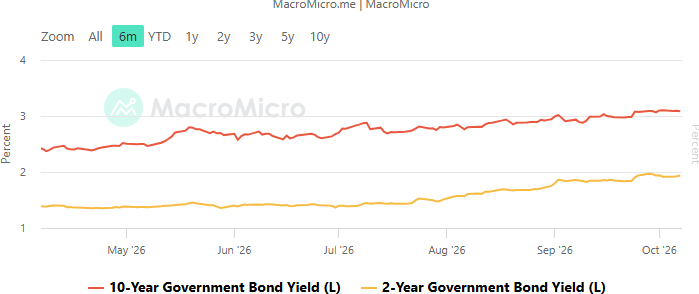
A widespread means there is a much larger difference between the yields. For example, Japan 2-year yield is 1.92% while the 10-year yield is 3.10%. The spread is 118 basis points.
That larger gap tells traders that the market is pricing a meaningful difference between the medium-term and longer-term outlook.
For the 2s10s spread, a widening spread can occur when investors expect short-term rates to fall while longer-term yields remain relatively elevated. This can happen when the market expects the Fed to cut rates but remains concerned about inflation, economic growth, Treasury supply, or the term premium further out.
For the 10s30s spread, a wider gap can indicate that investors demand more compensation for holding very long-duration debt. Fiscal deficits, increased Treasury issuance, persistent inflation expectations, or a rising term premium can all contribute.
Source: MacroMicro
The four most important government bond markets
U.S. Treasuries
The global benchmark for government bonds includes the 2-year, 5-year, 10-year and 30-year maturities. U.S. Treasury yields are heavily influenced by Federal Reserve expectations, inflation, economic growth, government borrowing and global demand for safe-haven assets.
Source: Trading economic
Europe
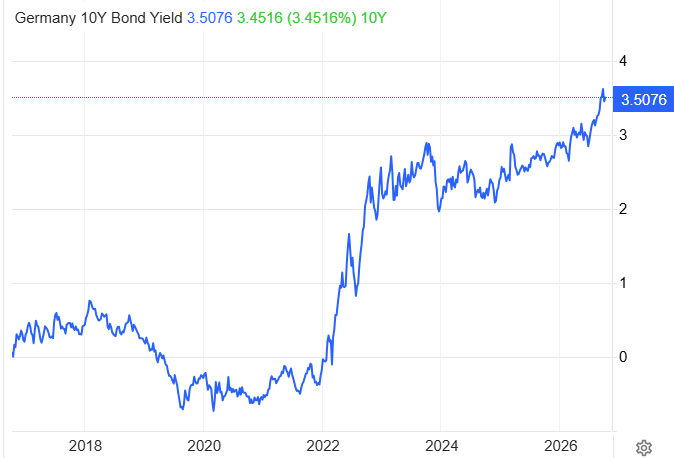
German Bunds are the main benchmark for the eurozone bond market. The German 10-year Bund yield is particularly important for European rates because it reflects expectations for the European Central Bank, eurozone inflation and growth, while also influencing borrowing costs across other eurozone economies.
Source: Trading economic
Japanese Government Bonds
Japan are central to Asian bond markets and closely linked to Bank of Japan policy. The 10-year JGB is especially important because changes in Japanese yields can affect the yen, global bond flows and the amount of Japanese capital invested overseas.
Source: Trading economic
UK Gilts
They are the benchmark for British government borrowing costs. Gilt yields are particularly sensitive to Bank of England expectations, UK inflation, economic growth and government fiscal policy. The 10-year and 30-year gilts are closely watched when markets assess the UK's longer-term borrowing costs and fiscal outlook.
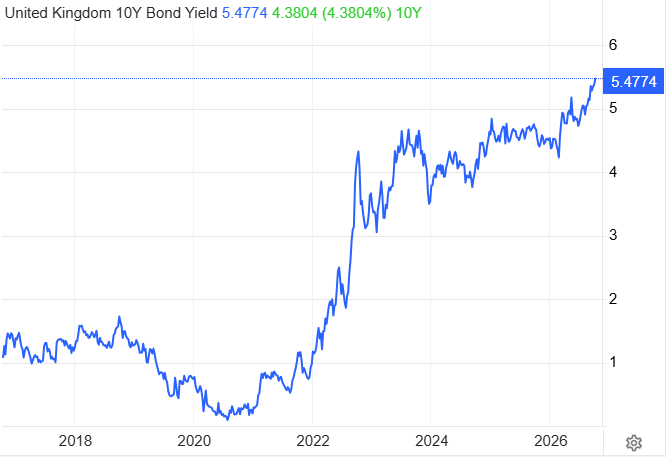
Source: Trading economic
How are bonds markets connected?
These four bond markets are closely connected through global capital flows. When U.S. Treasury yields rise, investors may demand higher yields from German Bunds, Japanese Government Bonds and UK Gilts to compensate for the relative return and currency risk.
At the same time, changes in Japanese or European yields can influence how much capital investors allocate to U.S. Treasuries, particularly when currency-hedging costs change. This means a major move in one market can spill into the others through interest-rate expectations, exchange rates, global risk sentiment and investor positioning.
FAQs
Why do bond prices and yields move in opposite directions?
Bond prices and yields move inversely because the coupon payment on an existing bond is fixed. When the bond price falls, that same fixed coupon represents a higher return for the new buyer, so the yield rises. When the price increases, the yield falls.
What is a bond and how does it work?
A bond is a debt security issued by a government, company or other institution to raise money. The investor typically receives periodic interest payments and the face value of the bond when it matures.
What is the face value of a bond?
Face value, or par value, is the amount the issuer promises to repay when the bond reaches maturity. A bond can trade above or below its face value in the secondary market before maturity.
What happens to bonds when interest rates rise?
When interest rates rise, newly issued bonds generally offer higher yields. Existing bonds with lower coupons become less attractive, so their market prices typically fall until their yields become competitive with newer bonds.
What is the difference between the 2-year, 10-year and 30-year Treasury yields?
The 2-year Treasury is particularly sensitive to expectations for Federal Reserve policy and the near-term economic outlook. The 10-year reflects a broader combination of monetary policy, inflation, growth and term premium. The 30-year is more sensitive to long-term inflation, fiscal policy, government borrowing and demand for long-duration debt.