Help
Help Wyckoff accumulation pattern explained for traders
The Wyckoff Accumulation Model is one of the oldest and most influential market theories in technical analysis. Developed by Richard D. Wyckoff in the early 1900s, it describes how large institutions gradually build positions before a sustained bullish trend begins. Instead of chasing breakouts, the model teaches traders to recognize the quiet phase where professional money absorbs supply while most of the market still sees uncertainty.

Wyckoff Accumulation explains how institutions build positions before an uptrend.
The model follows five phases, from stopping the downtrend to breaking into a new trend.
Supply and demand matter more than individual candles.
Spring and Sign of Strength are two of the most watched confirmation signals.
The model works best when combined with market structure and risk management.
What is the Wyckoff accumulation model?
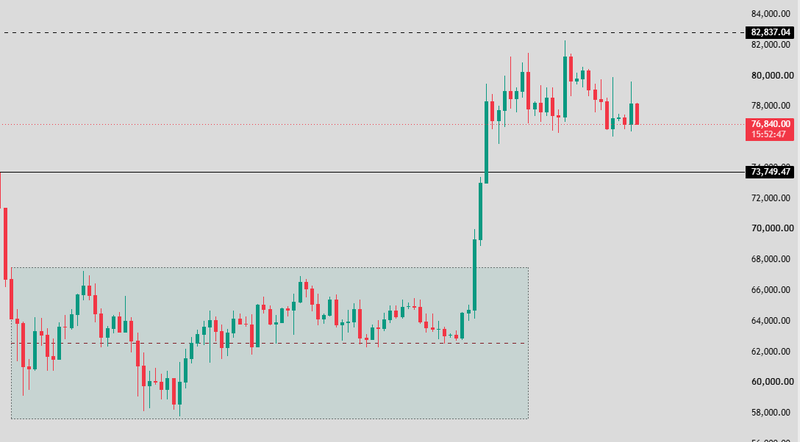
The Wyckoff Accumulation Model describes a period where large buyers gradually absorb selling pressure before a bullish trend develops.
After a prolonged decline, many retail traders expect prices to continue falling. Institutions often take the opposite approach. Instead of buying everything immediately, they accumulate positions over time while keeping price inside a range.
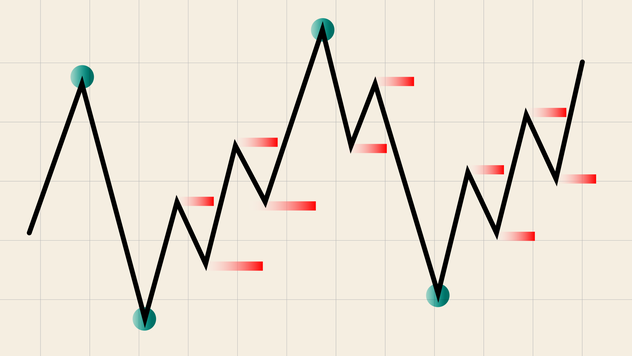
This process creates the sideways structure that defines accumulation
The important point is that accumulation is not simply consolidation. A normal range can appear anywhere in a trend. Wyckoff accumulation specifically represents a shift where supply is gradually being exhausted while stronger buyers quietly increase their positions.
Source: Trading view
Understanding Wyckoff's market rules
Wyckoff believed that price movement reflects the relationship between supply and demand. When selling pressure dominates, prices fall. When buying pressure gradually absorbs that selling, the market begins stabilizing. Once demand becomes stronger than supply, price has room to expand higher.
He also believed that markets move through repeating cycles rather than random fluctuations. Accumulation is one stage of that cycle, followed by markup, distribution, and markdown.
Instead of reacting to every candle, Wyckoff focused on reading the story that price and volume tell together.
The three Wyckoff laws
Wyckoff built his methodology around three core laws that still influence modern price-action trading.
The law of supply and demand
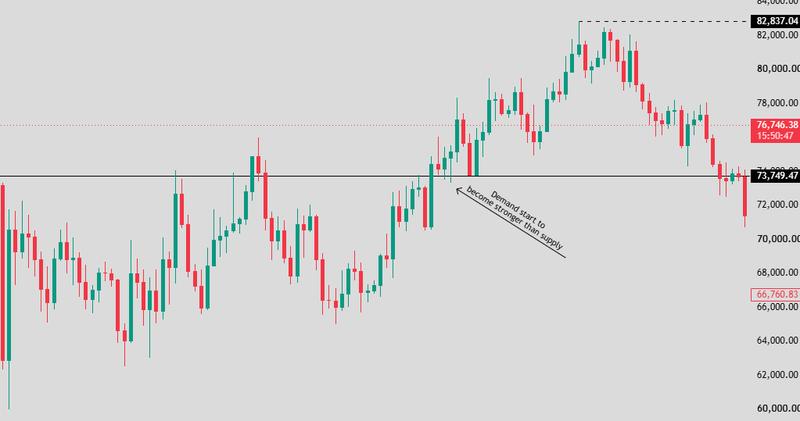
This is the foundation of the entire model. When demand becomes stronger than supply, prices tend to rise. When supply overwhelms demand, prices tend to fall.
Accumulation develops because demand gradually absorbs available supply without immediately producing a breakout.
Source: Trading view
The law of cause and effect
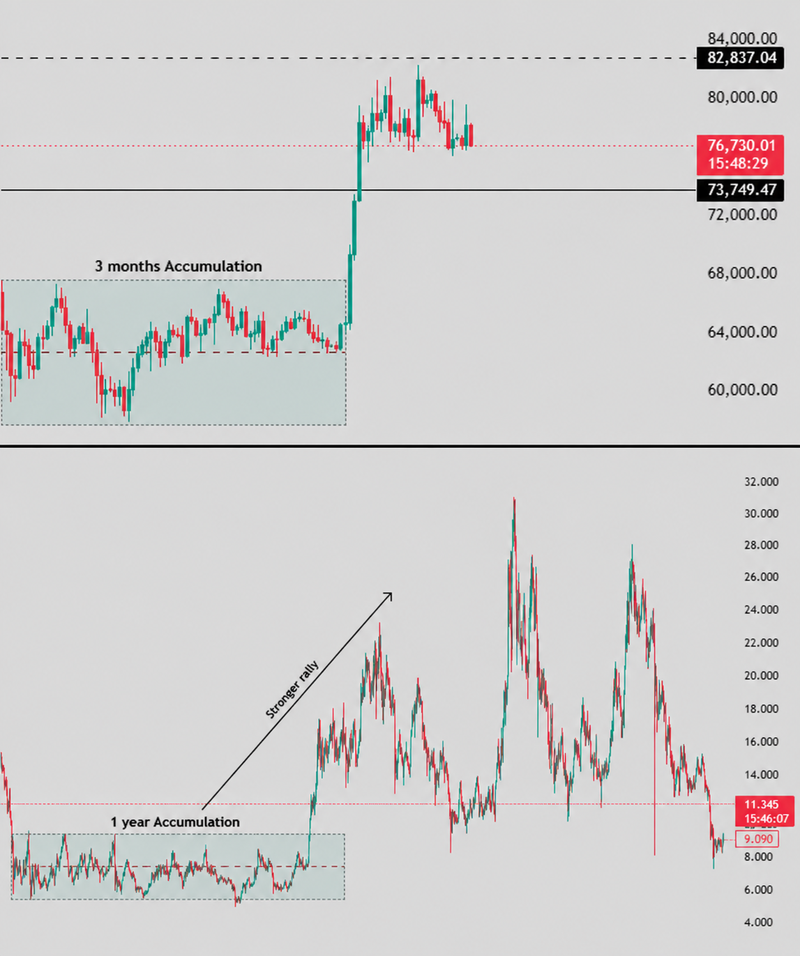
Wyckoff argued that a trading range creates the "cause" for the next major move. A short accumulation usually produces a smaller trend, while a longer accumulation often creates a larger expansion. The more time institutions spend building positions, the more potential energy may exist for the following markup.
Source: Trading view
The law of effort versus result
This law compares price movement with trading activity. If heavy buying produces little upward movement, sellers may still be absorbing demand.
If price suddenly begins moving higher with relatively little resistance, it suggests supply has become much weaker. This relationship helps traders judge whether accumulation is progressing or failing.
Wyckoff market cycle phases
Wyckoff viewed markets as moving through four repeating stages. Accumulation comes first, where stronger buyers build positions after a decline.
The market then enters Markup, where price rise with stronger momentum. Eventually, Distribution appears as institutions gradually reduce positions near the highs.
Finally, Markdown begins when selling pressure takes control and price trends lower.
Understanding accumulation becomes much easier when it is viewed as the transition between markdown and markup rather than an isolated pattern.
The anatomy of Wyckoff accumulation
A Wyckoff accumulation range contains several recurring events that reveal how supply gradually weakens.
The exact shape can vary between markets, but the underlying story remains similar.
Price first stops falling, begins ranging, tests weak holders, attracts fresh sellers, and eventually breaks higher once demand takes control.
The famous "Spring" often receives the most attention, but it is only one part of a much larger process.
The five phases: Step-by-step evolution
Phase A: The downtrend begins to stop
The first signs of accumulation appear when the previous downtrend begins losing momentum.
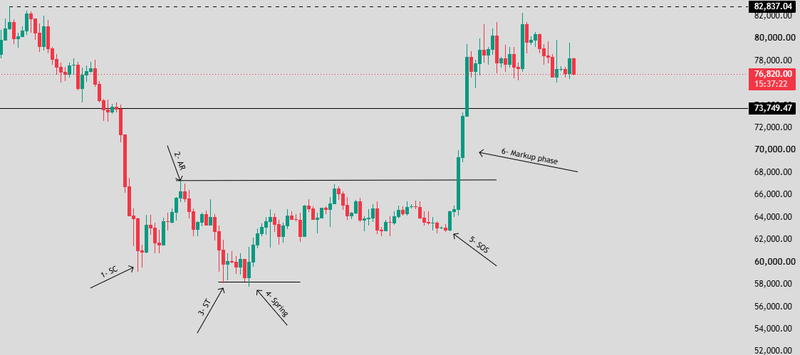
Selling Climax (SC) often marks aggressive liquidation before buyers step in. Price then rebounds into an Automatic Rally (AR), creating the upper boundary of the new trading range. At this stage, nobody knows whether the downtrend has finished.
Phase B: Institutions build positions
This is usually the longest phase. Price continues moving between support and resistance while institutions quietly absorb supply. Multiple tests of both sides of the range become common.
To impatient traders, the market looks directionless. To Wyckoff traders, this is where real work happens.
Phase C: The Spring
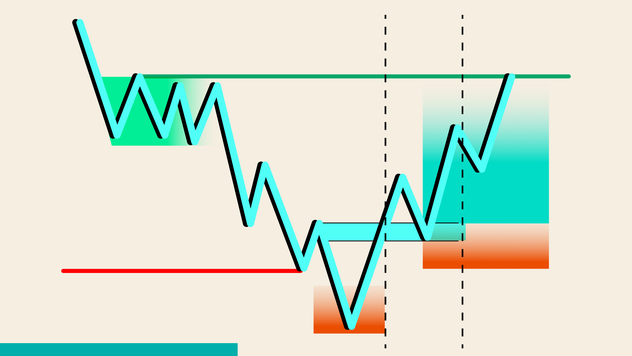
Spring is one of the most recognized parts of the model. Price briefly breaks below support, triggering stop-losses and encouraging fresh sellers before reversing back into the range.
The move resembles a modern liquidity sweep because it removes weak holders before the larger move begins.
Not every accumulation includes a perfect Spring, but when it appears, traders pay close attention to the market's reaction afterward.
Phase D: Strength appears
This is where buyers begin taking control. Price produces a Sign of Strength (SOS), breaking higher with stronger momentum. Instead of collapsing back into the range, pullbacks become shallower.
Many traders look for the Last Point of Support (LPS) during this phase because it often provides a cleaner continuation entry than buying the initial breakout.
Phase E: The markup begins
The accumulation process is complete. Price leaves the trading range and begins forming higher highs and higher lows. At this point, what looked like sideways movement now becomes visible as the foundation of the new bullish trend.
Source: Trading view
Entry strategies
The Wyckoff model offers several ways to participate, depending on how much confirmation a trader wants.
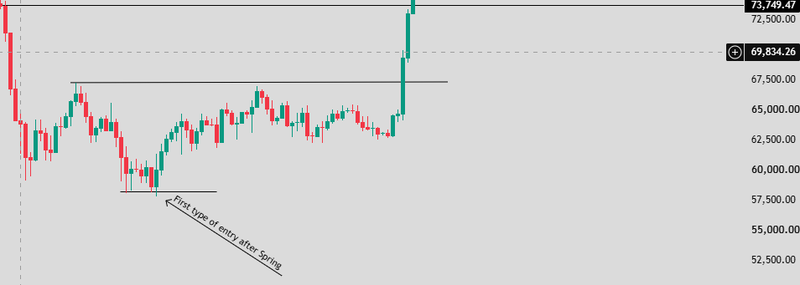
Spring entry
Some traders enter after Spring once price quickly reclaims support. This approach offers earlier entries but carries more risk because the reversal has not been fully confirmed yet.
Source: Trading view
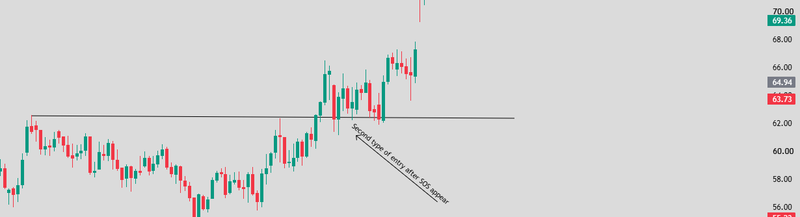
Last Point of Support entry
Many traders prefer waiting for the Last Point of Support. After the Sign of Strength breaks resistance, price often retraces before continuing higher. This pullback allows traders to enter after demand has already shown itself.
Source: Trading view
Breakout confirmation entry
The most conservative approach waits until price clearly leaves the accumulation range. Although this usually sacrifices part of the move, it reduces the risk of buying a failed accumulation.
Regardless of the entry method, many traders place stops below the Spring or below the structural low that invalidates the bullish idea, while targeting higher-timeframe resistance or previous swing highs.
Risks of the Wyckoff accumulation model
The Wyckoff model is powerful, but it is not guarantee that every range becomes a bullish breakout.
One of the biggest risks is misidentifying ordinary consolidation as accumulation. Markets can trade sideways for completely different reasons, and not every range contains institutional buying.
Another common mistake is buying too early. Price can remain much longer than expected, creating repeated false starts before genuine strength appears.
Spring itself also creates confusion. Some support breaks are true Springs, while others become the beginning of another bearish leg.
Volume interpretation can be another challenge because modern electronic markets do not always display institutional activity as clearly as traditional exchange-traded markets did during Wyckoff's time.
The safest approach is to combine accumulation with market structure, liquidity analysis, and disciplined risk management rather than relying on the pattern alone.
FAQs
What is the Wyckoff Accumulation Model?
The Wyckoff Accumulation Model describes how institutions gradually build positions after a downtrend before a sustained bullish trend begins.
What are the five phases of Wyckoff Accumulation?
The five phases are Phase A (stopping the decline), Phase B (building positions), Phase C (the Spring), Phase D (Sign of Strength), and Phase E (the markup).
What is a Spring in Wyckoff?
A Spring is a temporary break below support that sweeps liquidity before price quickly returns into the trading range.
What is the Sign of Strength (SOS)?
The Sign of Strength is a strong bullish move that breaks higher from the accumulation range and shows that demand is beginning to dominate supply.
Does Wyckoff work in forex, gold?
Yes. Although Wyckoff was originally developed for stocks, traders now apply the same accumulation principles to forex, commodities, indices by analysing price action and liquidity.