Technical Analysis 101
Learn how to use technical charts and examine market behaviour to make more informed trading decisions.
Technical analysts read technical charts to identify past price trends and predict future opportunities
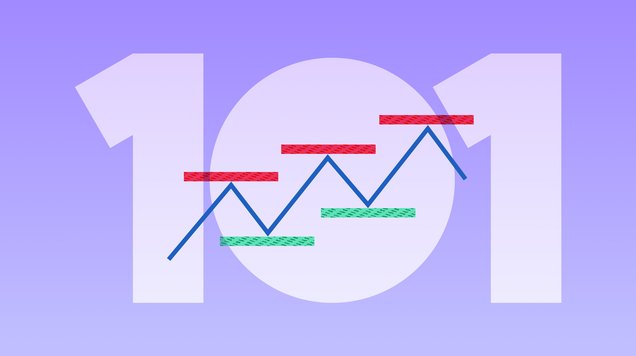
Online traders can use technical analysis to forecast the best possible time to buy or sell assets, which is typically indicated by support and resistance levels
Technical analysis is based on three main principles: Price is the primary focus; prices move in trends and history repeats itself
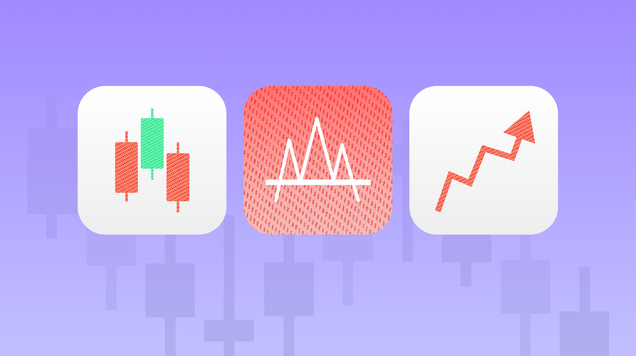
Charts, patterns and indicators are the key tools for a technical analyst
What is technical analysis?
Technical analysis refers to reading price charts to identify patterns and trends that can be used to make smarter trading choices.
Compared to fundamental analysis that focuses on financial data and economic factors, technical analysts believe that past price movements and trading activity are the key into anticipating future movements in an asset’s price.
Traders can interpret market data and predict potential price behaviour by using tools like support and resistance levels, moving averages and trendlines. Technical analysts also look for historically successful patterns on market charts to forecast future trends, such as triangles, flags and head and shoulder patterns.
Technical analysis can be applied to any financial asset with enough historical price data. Whether you are trading stocks, forex, indices or ETFs, you can use technical analysis tools to create charts and patterns and predict the future price movements.
Fundamental principles of technical analysis
Technical analysis is based on key fundamental principles. Let’s have a closer look into the three main ideas of the method.
- Price is the primary consideration, and technical analysts focus primarily on price movements. Price movements are not random, but rather follow trends that can be identified and exploited for profit. Markets tend to move in cycles, and that these cycles can be identified through the analysis of historical price data.
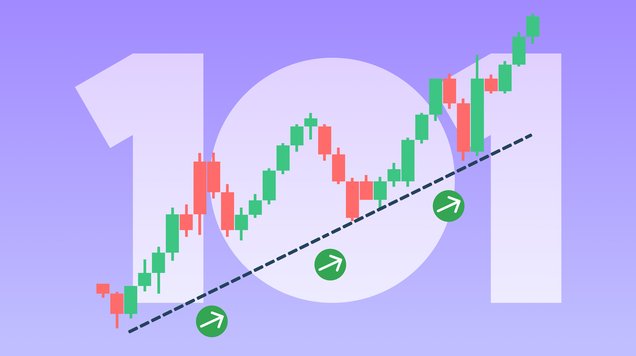
- Trends exist, and markets tend to move in a certain direction over time. There are three types of trends in technical analysis: uptrends, downtrends and sideways trends. Understanding and identifying trends is essential for successful trading and investing. By identifying the direction of a trend, traders can determine whether it is more favourable to buy or sell a stock.
- History repeats itself, and past price movements and chart patterns can provide valuable insights into future price movements. Technical analysts use historical price data to identify patterns that may suggest the direction of future price movements. Technical analysis is not a fool proof method for predicting future prices, but a thorough understanding of price history can help traders make more informed decisions about when to buy, sell or hold a particular security.
Origin and key theories of technical analysis
Technical analysis has its origin in the theories published by Charles Dow in the late 1800s. Most of the basic ideas of modern technical analysis are based on the Dow theory, including the definition of a trend and classification of a trend into categories.
In addition to Charles Dow, major figures in the field of technical analysis include John Magee, John Murphy and Martin Pring. While they share common interest in interpreting market data and using charts to forecast price swings, their approaches and definitions slightly differ.
John Magee defined technical analysis as the examination of market behaviour with the objective of predicting forthcoming price trends in his 1948 publication titled ‘Technical Analysis of Stock Trends’.
According to Magee, the value of a stock contains all relevant information about a particular company, such as its financial performance and market situation. Magee believed that price and volume patterns can indicate supply and demand market dynamics. He also thought that successful technical analysts must balance the quantitative aspects of technical analysis with their own subjective interpretations.
John Murphy agreed with Magee that technical analysis should be defined as a study of market action primarily through chart analysis with the aim of forecasting future price trends. According to Murphy, technical analysts know that this is a reason behind price movements but it’s not necessary to study these reasons in order to be able to predict the future direction of the prices. Murphy’s book ‘Technical Analysis of the Financial Markets’ is one of the most important titles of the field.
Martin Pring defined technical analysis as the reflection of the notion that prices move in trends, which are influenced by evolving investor sentiments towards a broader range of economic, monetary, political and psychological factors. Pring emphasized the use of various indicators such as moving averages, oscillators and trendlines to identify trends, reversals and potential entry and exit points.
Introduction to technical analysis tools
The main tools used in technical analysis are charts and indicators. Charts are visual representations of the price movements, whereas indicators are different approaches to read the information provided by the charts.
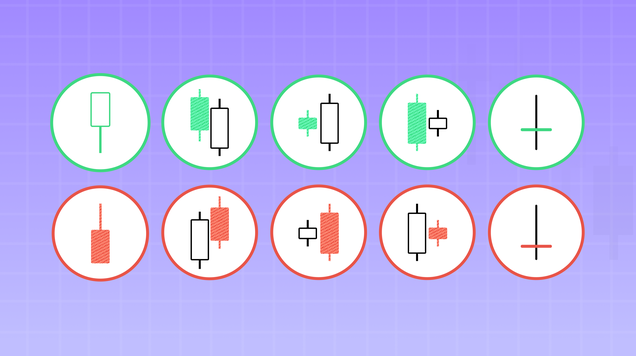
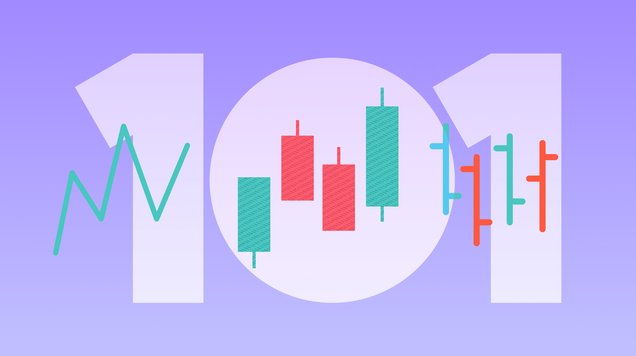
The charts can be presented as lines, bars or candlesticks and they can be constructed for any chosen time period. The bar and candlestick charts show the open and closing prices for each trading day but also the highest and lowest points of the price during the day. The line chart only shows the closing prices. Information about trading volumes can be included in a chart. This is usually done as bars at the bottom of the chart. On an online trading platform, you can easily adjust the charts and choose the style and data included.
In technical analysis, support and resistance are two crucial concepts that hold significant importance in interpreting price charts. These concepts are based on the principle that market prices are affected by the interplay of supply and demand. When demand surpasses supply, prices tend to rise, while when supply exceeds demand, prices fall. In certain situations, prices may remain stagnant when supply and demand are balanced.
Technical analysts use patterns and indicators with the charts to identify trends and generate trading signals.
Patterns can be divided into two categories: reversal and continuation patterns. Reversal patterns usually indicate that there is a trend reversal in progress, whereas continuation patterns suggest that sideways price action is just a pause in an existing trend. Head and shoulders and inverse head and shoulders are examples of reversal patterns, while triangles belong to the category of continuation patterns.
Moving averages are one of the most used indicators in technical analysis. Simple moving average is an average of prices over a specified time period and can be calculated based on closing, opening, minimum or maximum prices. However, it’s common to use the closing price for the calculation.
Other widely used indicators include Moving average convergence divergence (MACD), Relative strength index (RSI), Stochastic oscillator, Bollinger bands, Fibonacci retracement and Average directional index (ADX).
Depending on your trading strategy, some tools might be more useful for you than others and testing is usually required to find out the tools that work best for your trades.
Why should you use technical analysis
Trading is all about predicting the price movements of an asset correctly and conducting market analysis is crucial for making informed decisions about your trades.
Technical analysis is adaptable to different trading strategies and styles. It’s often used for short-term trading strategies, but it can be equally useful for traders holding longer-term positions.
If you are trading several products, it’s easy to follow multiple markets and products at the same time with technical analysis tools. With fundamental analysis, traders often focus on a limited number of markets or products as an in-depth analysis can be more time-consuming.
Technical analysis is an easy way for beginners to get into market analysis as the online trading platforms often have a variety of technical analysis tools available for free. Opening a risk-free demo account allows you to explore the tools and test different chart types and indicators before investing any capital.
Although technical analysis is a popular method for traders to select when to open or close a position, it's important to remember that there are no guarantees of success. Traders should use technical, fundamental and other forms of analysis for managing risk and forming a fuller understanding of underlying market conditions.
