Trend Analysis 101
Read our beginners’ guide to trend analysis and learn how to detect market trends and spot profit opportunities
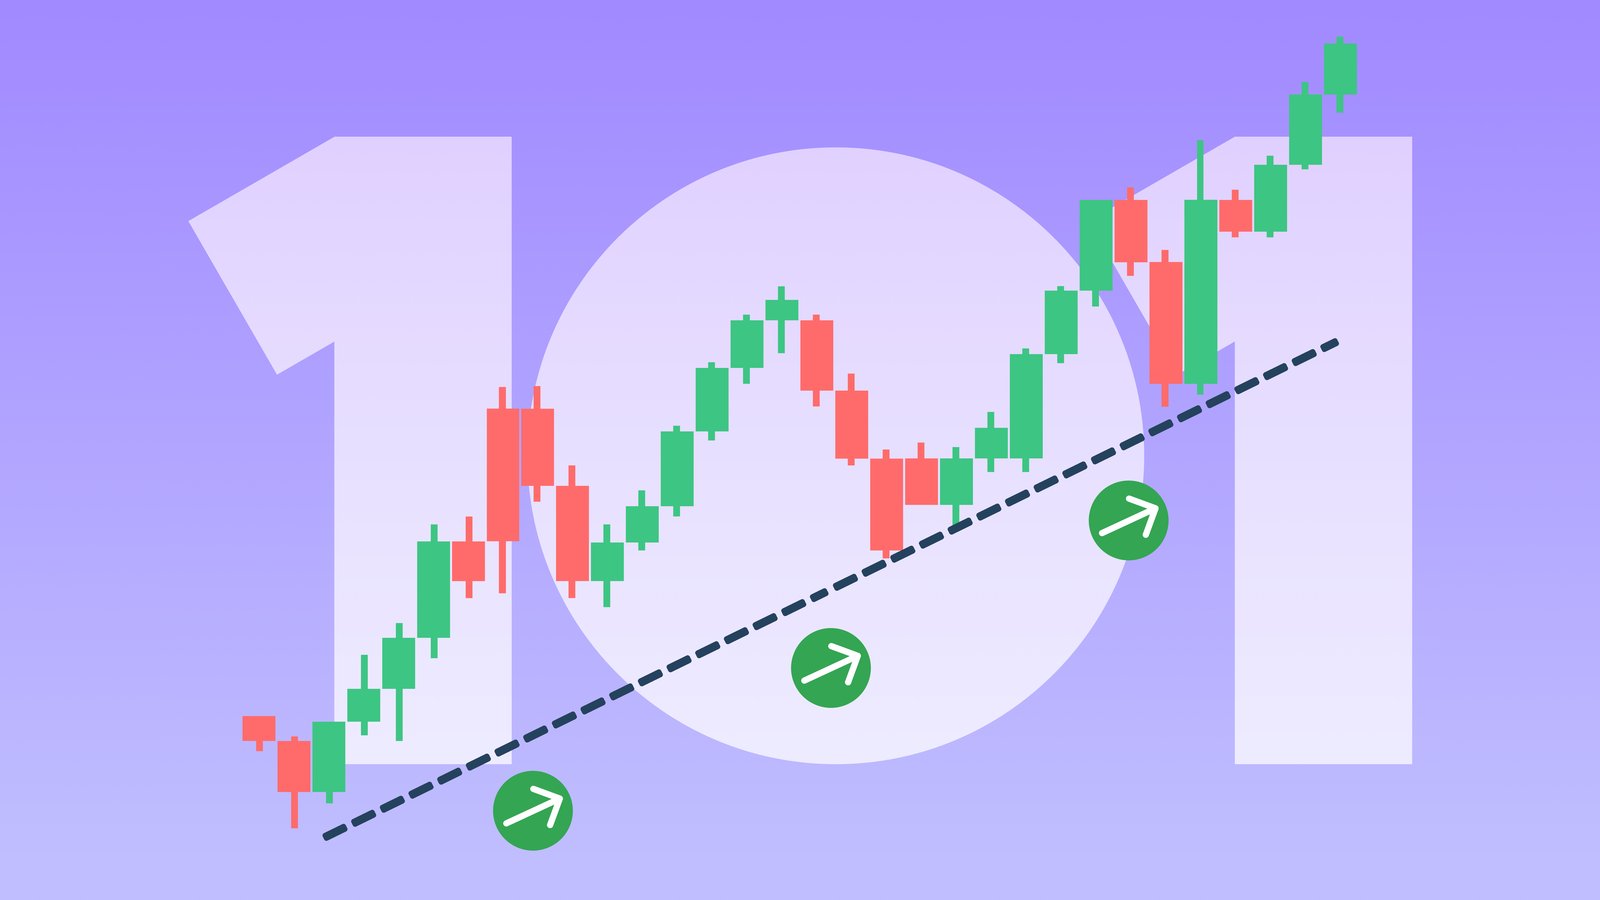
Trend analysis involves assessing historical price data to identify current market trends and predict future price movements
Moving Averages, support and resistance levels, RSI and trendlines are commonly used tools by trend analysts
Identifying market trends allows traders to decide whether to buy or sell, establish optimal entry and exit points for their trades, and to benefit from price movements
Trend analysis can be combined with fundamental and sentiment market analysis to better understand price moves
Introduction to trend analysis
In trading and investing, market analysis refers to the process of evaluating data related to a financial market in order to establish insights into its current and future conditions. Traders use market analysis to make better informed decisions about buying and selling assets like shares, commodities, and currencies.
Trend analysis is an approach to market evaluation that focuses on studying previous price data in order to identify trends and patterns, that can help predict the future price movements of a financial asset. It’s based on the idea that previous price events provide useful insights about what will happen to the price next.
Traders who use trend analysis often interpret charts and graphs. They are looking for indicators of whether an asset’s price is likely to rise, fall or stay the same. Short-term traders may focus on hourly and daily charts, while long-term traders usually focus on identifying trends that are established in weekly and monthly charts.
Trends are usually divided into three categories: uptrend, downtrend and sideways. In an uptrend, the price moves in a direction of higher highs and higher lows and in a downtrend, both highs and lows get lower. In a sideways trend, the price moves within a relatively narrow range without making significant movements up or down.
Trend analysis is a form of technical analysis as it relies on technical tools and indicators to identify trends or forecast future price action. In order to make a stronger analysis of the prevailing trend, trend analysis can be combined with other market analysis methods, such as fundamental and sentiment analysis.
Useful tools for trend analysis
Traders conducting a trend analysis can use a variety of tools and indicators to detect market moves.
Here are some common methods:
Trendlines are the most popular charting tool for identifying trends. Drawn on a price chart by connecting series of asset’s prices together, they are a straightforward tool to visualise trend direction and potential reversal points. To be able create a trendline, there should be at least two top or bottom prices to connect to each other.
Support and resistance levels are key concepts in technical analysis and are crucial for trend analysis too. Support levels refer to the level that usually supports the price of an asset, meaning that the price is not likely to fall below it. Resistance levels refer to the highest level that the price has reached within the current trend, until it has been pushed down. Trend traders can use support and resistance levels to gauge the strength of the trend, and to predict potential reversals as these levels often act as barriers where prices might reverse or consolidate at.
Moving Averages calculate the average of prices over a specific time period, usually by using the closing prices. Moving Averages help traders to identify the direction of the overall trend as they mitigate the impact of short-term price fluctuations. Simple Moving Averages (SMA) and Exponential Moving Averages (EMA) are the most common types of moving averages.
Relative Strength Index (RSI) measures the magnitude of recent price changes, indicating whether an asset is has been overbought or oversold. An RSI provides a value between 0-100, where above 70 means the asset is overbought and below 30 means it has been oversold. An RSI can help traders to assess the strength of a trend and identify optimal entry and exit points.
All the technical analysis tools and indicators mentioned above can be found on online trading platforms like MetaTrader 4 and MetaTrader 5. They are free to use, and you can easily combine several tools and indicators to perform a comprehensive trend analysis.
Benefits of trend analysis
Trend analysis is a valuable tool in trading, offering simplicity, risk management and entry and exit point identification in addition to identifying trends. Here are some reasons why traders should consider including trend analysis to their trading strategy.
- Simplicity: Trend analysis is relatively easy to understand and use, making it accessible to traders of all experience levels.
- Entry and exit points: Using trend analysis can help traders to improve the timing of their trades as the analysis assists in pinpointing optimal points to open and close their trading positions.
- Effective risk management: Understanding the trend, establishing the support and resistance levels, and predicting potential reversals can allow traders to set precise stop loss orders and manage risk more effectively.
- Adaptability: Trend analysis can be applied to various financial markets including currencies, shares, and commodities. It’s also adaptable to short-term strategies and longer-term investment plans.
However, trend analysis also has its disadvantages, such as lagging indicators that may not provide timely signals for fast-moving markets, or false signals that may lead to losses if a price reverses too quickly. It is always important to use risk management tools, monitor markets closely and
Combining trend analysis with other approaches
To get a comprehensive view of markets and to better predict future price movements, trend analysis should be combined with other forms of market research. Trends are mostly identified by using technical indicators, but combining other forms of market analysis can help to understand why trends are born and how long they might last.
Fundamental analysis involves evaluating the intrinsic value of an asset by examining factors such as earnings, financial health, and economic indicators. Combining trend and fundamental analysis helps traders to identify assets that not only show technical strength but also have strong underlying fundamentals. This reduces the risk of investing in assets with unsustainable price movements driven solely by market sentiment.
Sentiment analysis focuses on evaluating market sentiment and traders' emotions through sources like social media, news, and market sentiment indicators. By integrating sentiment analysis with trend analysis, traders can gain deeper understanding of why a trend is occurring. It can also help to predict potential trend reversals driven by changes in market sentiment.
When combined with fundamental and sentiment analysis, trend analysis becomes an even more powerful strategy, allowing traders to make well-informed decisions that consider both technical and fundamental aspects.
