Fundamental review of U.S. stocks post-Q2 results
U.S. corporates posted broadly solid Q2 2025 results, with widespread beats on earnings and revenue. Yet elevated multiples and heavy market-cap concentration point to stretched valuations, even as U.S. equities have lagged several global benchmarks year to date.

About 81% of S&P 500 companies beat on earnings and revenue.
Average operating and net margins are roughly 19% and 13%, respectively.
The analysis points to overvaluation and high market-cap concentration in a few sectors.
Despite indices near records, YTD performance trails several global markets.
Q2 results vs. estimates (U.S.)
Using the S&P 500 as reference, U.S. companies delivered firm Q2 2025 results. EPS growth (YoY) was 11.8%, and roughly 81% of companies reported earnings above estimates. Sectors with the largest positive surprises versus consensus included Information Technology, Financials, Consumer Staples, and Health Care, while Materials and Energy underperformed (FactSet Research Systems, August 2025).
On revenue, S&P 500 companies posted ~6.3% YoY growth, with around 81% beating sales estimates. Revenue upside was most notable in Information Technology and Health Care, while Real Estate and Materials lagged consensus (FactSet Research Systems, August 2025).
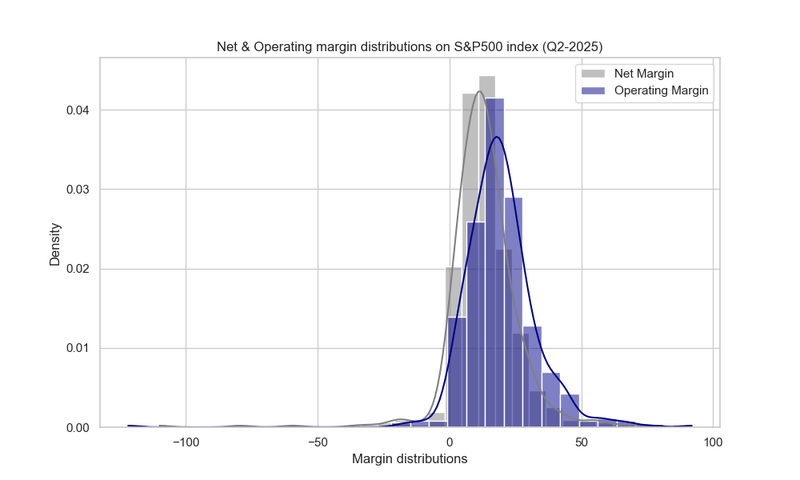
Profit margins: level and distribution
Across the S&P 500, operating and net margins cluster around their averages but with heavy tails. The average operating margin is about 19.4%, and the average net margin is 13.19%. Distribution diagnostics showed kurtosis of ~21 for operating margins and ~19 for net margins, indicating significant outliers. In the cross-section, some firms show operating losses near −121% and others operating profits up to 92%; net losses to −110% and net profits up to 81% also appear.
While a deeper industry-by-industry cut would be needed for firm conclusions, industry averages span ~7% to 76% for operating margins and ~5% to 64% for net margins. That dispersion suggests outliers are not necessarily skewing the industry-level means across the S&P 500.
Relative valuation of S&P 500 companies
While index companies’ profit margins appear competitive, valuation is the open question. The next figure shows sector weights by share of total S&P 500 market cap. Five sectors dominate—Technology Services (24.5%), Electronic Technology (21.0%), Finance (14.6%), Retail Trade (8.0%), and Health Technology (7.0%)—together representing ~76% of the index.
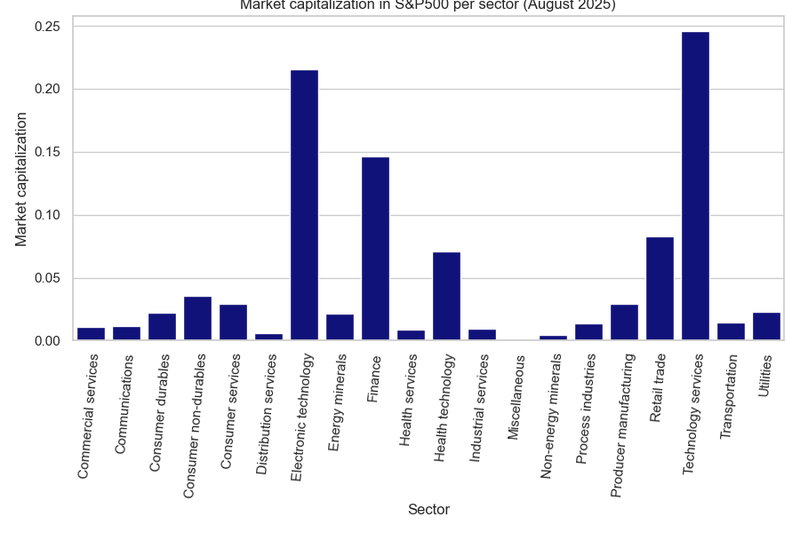
Such concentration should be supported by fundamentals (earnings power and growth). The following figure shows sector P/E and PEG ratios. On average, P/E ≈ 43.3x and PEG ≈ 4.99x—both elevated versus common benchmarks: the 10-year average S&P 500 P/E is ~18.5x (Butters, 2025; FactSet), and a “fair” PEG is often cited near 1x.
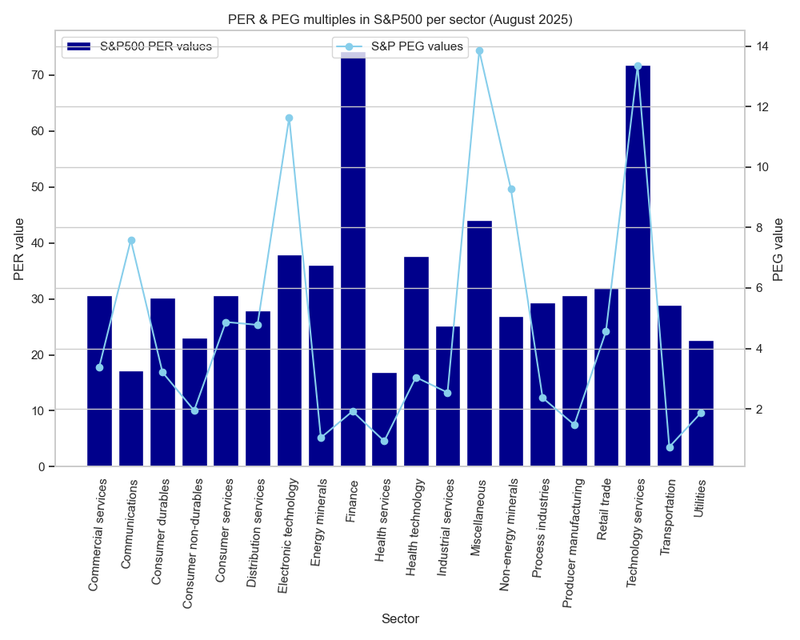
For the five largest sectors, headline multiples indicate overvaluation relative to history or theoretical norms:
- Technology Services: P/E 71.8x; PEG 13.35x
- Electronic Technology: P/E 38.0x; PEG 11.64x
- Finance: P/E 74.23x; PEG 1.92x
- Retail Trade: P/E 31.98x; PEG 4.56x
- Health Technology: P/E 37.67x; PEG 3.04x
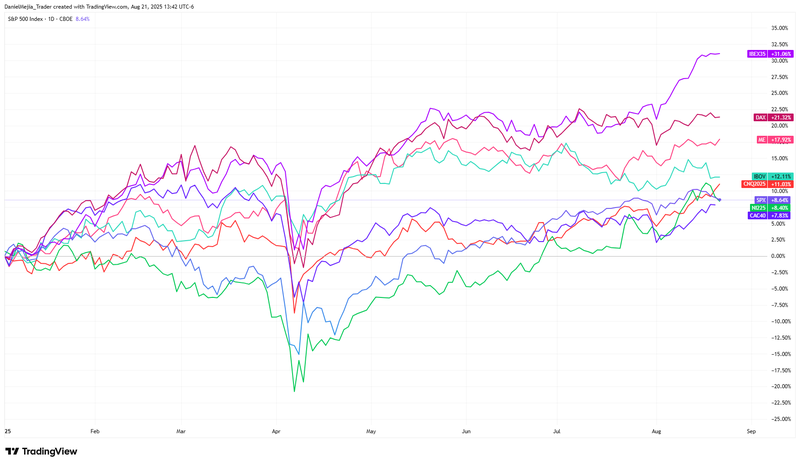
Global performance comparison
Elevated valuations matter most when investors have attractive alternatives. While this article does not extend to non-U.S. multiple comparisons, flows appear to be seeking more attractively valued opportunities in other regions. Despite U.S. indices hovering near highs, the 2025 YTD performance has trailed several global benchmarks. Illustratively: IBEX +31%, DAX +21%, IPC (Mexico) +18%, Bovespa (Brasil) +12%, China A50 +11%, S&P 500 +8.6%, Nikkei (Japan) +8.4%, CAC (France) +7.8%.