Dollar index advances on renewed confidence in Fed autonomy
The US Dollar Index (DXY) rebounded by 1.02% as market participants found optimistic in the Federal Reserve's potential independence following President Donald Trump’s nomination of Kevin Warsh as the next Fed Chair. In addition to political developments, the release of US Producer Price Index (PPI) data exceeded analyst forecasts, driving upward revisions for inflation expectations and bolstering the greenback's recovery.

The Dollar Index appreciated by 1.02%, reaching 97.15 points, following the official announcement of Kevin Warsh as the nominee to succeed the current Federal Reserve leadership.
December’s PPI data revealed an acceleration in core producer prices, with headline indicators surpassing consensus estimates.
While the Dollar Index remains within a long-term bearish trend, short-term momentum indicators suggest a strengthening bullish impulse.
Dollar index rises amid positive expectations for Fed independence
The US Dollar Index (DXY) settled approximately 1.02% higher at 97.15 points, marking a significant recovery after nearly a fortnight of sustained depreciation. This reversal followed President Donald Trump’s announcement on Friday, 30 January 2026, that he intends to nominate former Federal Reserve Governor Kevin Warsh as the next Chair of the Fed. Market participants interpreted the selection of Warsh—a Wall Street veteran—as a move that could preserve the central bank’s autonomy. Although Warsh has previously voiced support for lower interest rates, analysts view him as a more neutral and institutionalist choice compared to other potential candidates, thereby easing fears of direct political interference in monetary policy.
Simultaneously, data from the US Bureau of Labor Statistics provided further tailwinds for the dollar. The Producer Price Index (PPI) rose by 0.5% in December, keeping the year-on-year level at 3.0%, which was notably higher than the 2.7% anticipated by analysts. More significantly, the core PPI—which excludes the volatile food and energy sectors—accelerated from 3.1% to 3.3%, surpassing the 2.9% forecast. Market observers suggest that the uptick in producer costs may be linked to the recent implementation of tariffs, which are exerting upward pressure on industrial overheads. This persistent inflationary data has reinforced the "higher-for-longer" narrative, providing immediate support for the DXY at the market close.
Technical analysis of the Dollar Index (DXY)
From a technical perspective, the Dollar Index remains entrenched in a long-term bearish trajectory. However, a granular examination of the current market structure reveals a possible inflection point:
- Trend Context: Over the medium term, the index continues to exhibit a classic bearish structure of "lower highs" and "lower lows." The DXY remains positioned below its primary 50, 100, and 200-period Simple Moving Averages (SMAs), confirming the prevailing downward trend. Nevertheless, short-term indicators are currently flagging a loss of momentum in this bearish cycle.
- Resistance Levels: To the upside, the 98.6-point level represents a formidable technical hurdle, as it converges with the 50, 100, and 200-period SMAs alongside a historical ceiling. A decisive breach above this zone would pivot the focus toward the 100-point psychological barrier. A sustained move above 100 would signal a major structural shift toward a higher trading range.
- Support Levels: On the downside, immediate support is identified at 96.5 points. If this floor is invalidated, the next structural target is 95.3, which aligns with the lower boundary of the medium-term descending channel. A breach of the 95.3 level would likely precipitate a deeper market correction.
- Momentum and Volume: The Moving Average Convergence Divergence (MACD) is exhibiting a bullish divergence that has been developing for approximately nine months, indicating that downside momentum is waning . Furthermore, the Relative Strength Index (RSI) has successfully rebounded from oversold conditions, signalling a recovery in short-term bullish momentum.
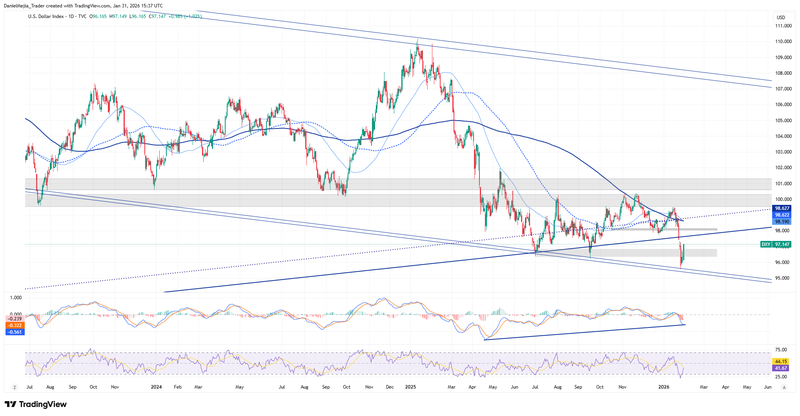
Figure 1. Dollar Index DXY (2023–2026). Source: Data from the Intercontinental Exchange (ICE); own analysis conducted via TradingView.


