Dollar index climbs as higher energy prices stoke inflation fears
The US Dollar Index (DXY) has appreciated by approximately 1.5% over the last three days, driven by escalating geopolitical volatility in the Middle East. The rise in the geopolitical risk premium follows significant disruptions in energy logistics, specifically affecting the Strait of Hormuz, which has sparked fears of a renewed inflationary cycle.

Tensions in the Middle Eastern region have surged, leading to a marked increase in the risk premium embedded in global currency and commodity markets.
Crude oil and gasoline prices have advanced considerably as the market prices in potential supply chain constraints and production cuts.
Although the DXY remains within a broader long-term bearish channel, short-term indicators signal a bullish reversal, with the index currently trading above its 50, 100, and 200-day Simple Moving Averages (SMAs).
Increasing energy prices generate concerns over potential inflation rebound
The US Dollar Index (DXY) recorded its second consecutive session of appreciation as market participants reacted to intensifying conflict in the Middle East. Global energy supply was compromised following reports that the Strait of Hormuz—a critical maritime chokepoint—has been effectively closed to tanker traffic by Iranian forces. This action followed retaliatory responses to coordinated US-Israel military strikes on Iranian territory on last Saturday, 28 February 2026.
According to reports from Reuters, Iraq—the second-largest crude producer within OPEC—has been forced to slash production by approximately 1.5 million to 3 million barrels per day due to an acute lack of storage capacity, as tankers are unable to transit the region. This supply-side pressure has been compounded by announced refinery closures and production curbs in Saudi Arabia, Israel, and Qatar. Consequently, energy benchmarks have rallied significantly: the Brent crude oil futures contract (BRNK26) has surpassed the $80 per barrel threshold, while West Texas Intermediate (WTI) (CLJ26) is approaching $75. Simultaneously, gasoline futures (RBJ26) have appreciated by roughly 25% over the last three days.
The spike in energy costs has reignited concerns that US inflation may rebound, potentially derailing the anticipated path of monetary easing. The CME FedWatch Tool currently reflects these shifting expectations, with market participants now pricing in interest rate cuts for July and December, a hawkish delay from the previously forecasted timeline of June and October. Persistent high energy prices may compel the Federal Reserve to adopt a "higher-for-longer" stance or even consider a return to more restrictive policy measures. Against this backdrop, the DXY has gained 1.5% in the short term, firmly establishing itself above the 99.00 threshold.
Technical analysis of the Dollar index (DXY)
From a technical perspective, the Dollar Index remains entrenched within a primary long-term bearish trajectory. However, the current market structure reveals a significant short-term shift:
- Trend Context: Over the medium term, the index continues to exhibit a structural bearish sequence of "lower highs" and "lower lows". Nevertheless, the recent rally has pushed the DXY above its primary 50, 100, and 200-day Simple Moving Averages (SMAs). This upside crossover suggests a recovery of key support levels and a potential challenge to the prevailing trend.
- Resistance Levels: To the upside, the 99.50 level constitutes a formidable technical hurdle. A decisive breakout above this zone would pivot market focus toward the 100.00 and 101.00 structural resistance levels. A sustained move above 101.00 would signify a major shift into a higher medium-term trading range.
- Support Levels: On the downside, immediate support is identified at 98.00. Should this floor fail to hold, the next critical area is 96.50, representing a significant short-term support pivot. A breach of the 96.50 level would likely facilitate a deeper bearish correction.
- Momentum: Both the Moving Average Convergence Divergence (MACD) and the Relative Strength Index (RSI) are trending upward, indicating a strengthening of short-term bullish momentum. Notably, the MACD signal follows a slight bullish divergence, which often serves as a precursor to more sustained price recovery.
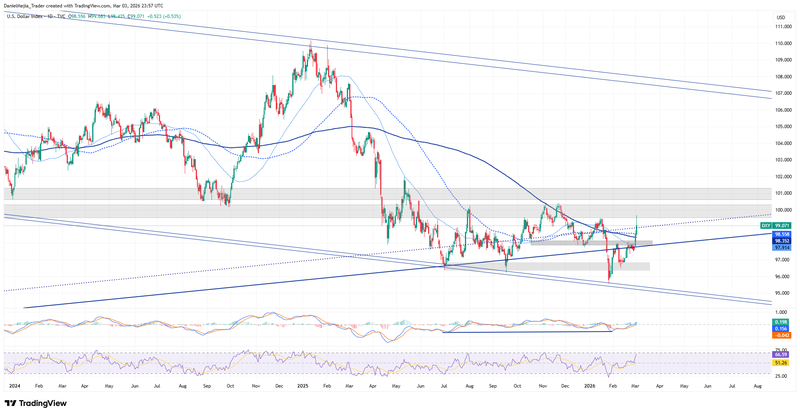
Figure 1. Dollar Index DXY (2024–2026). Source: Data from the Intercontinental Exchange (ICE); own analysis conducted via TradingView.


