Dollar rises on strong PPI; Fed holds rates, flags energy uncertainty
The US Dollar Index (DXY) advanced following a higher-than-expected Producer Price Index (PPI) print and intensifying concerns regarding an inflationary rebound linked to escalating conflict in the Middle East.

The US Producer Price Index rose from 2.9% to 3.4%, driven by persistent price pressures in the services sector and rising costs for agricultural products such as vegetables and eggs.
During its recent policy meeting, the Federal Reserve highlighted significant inflationary risks stemming from volatile energy prices, exacerbated by ongoing tensions in the Middle East.
The Dollar Index is currently testing a critical resistance zone, bolstered by market expectations that the Federal Reserve may adopt a more restrictive (hawkish) stance to curb price pressures.
US PPI exceeds forecasts as Fed highlights energy-driven inflationary risks
According to data released by the US Bureau of Labour Statistics, the Producer Price Index (PPI) accelerated from 2.9% in January to 3.4% in February, significantly surpassing the consensus analyst estimate of 2.9%. This reading marks the highest level since February 2025, suggesting that the upward trend may become a relevant structural pattern if it continues through the coming months. Concurrently, Core PPI—which excludes volatile food and energy components—rose from 3.5% to 3.9% over the same period.
The PPI report indicates that the headline increase was primarily driven by higher service costs and specific commodity prices, notably vegetables and eggs. While the full impact of surging energy costs is expected to manifest in next month’s data, February’s figures were largely influenced by services, tariffs, and food. Simultaneously, the Federal Reserve elected to leave the benchmark interest rate unchanged, citing the risk of renewed inflationary pressure should the US-Israel-Iran conflict persist and cause further supply chain disruptions in the Middle East.
In response, the US Dollar Index (DXY) rose by 0.65% to 100.20 points, as market participants began pricing in a more hawkish Federal Reserve trajectory in the event of further geopolitical escalation.
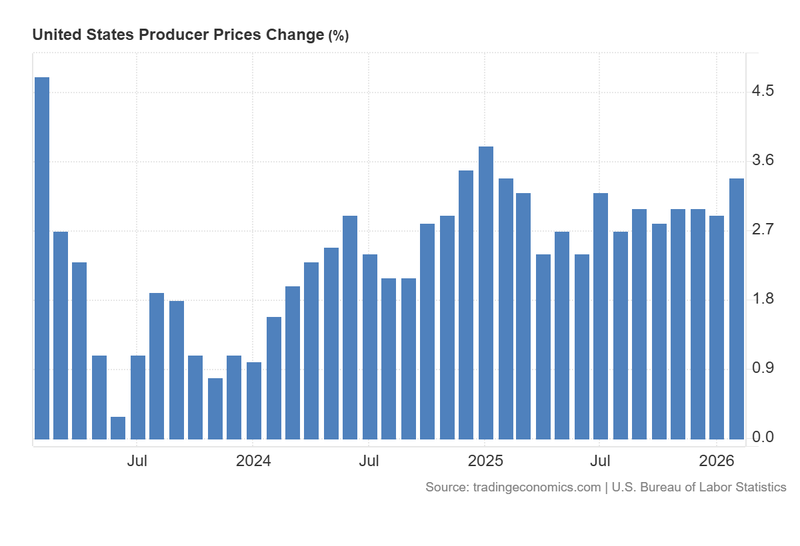
Figure 1. US Producer Price Index YoY (2023-2026). Source: Data from the US Bureau of Labour Statistics; Figure obtained from Trading Economics.
Technical analysis of the dollar index (DXY)
From a technical perspective, the Dollar Index remains situated within a primary long-term bearish trajectory. However, the current market structure reveals a notable short-term shift:
- Trend Context: Over the medium term, the index continues to exhibit a structural bearish sequence of "lower highs" and "lower lows". Nevertheless, the recent rally has propelled the DXY above its 50, 100, and 200-day Simple Moving Averages (SMAs). This upside crossover suggests a recovery of key levels and a potential challenge to the broader prevailing trend.
- Resistance Levels: To the upside, the 100.5 level constitutes a formidable technical hurdle. A decisive breakout above this zone would shift market focus toward 104.0 points. A sustained move above 104.0 would signify a major transition into a higher medium-term trading range.
- Support Levels: On the downside, immediate support is identified at 99.5. Should this floor fail to hold, the next critical area is 98.0, representing a significant short-term support pivot situated close to the 200-day SMA. A breach of the 98.0 level would likely facilitate a deeper bearish correction.
- Momentum: Both the Moving Average Convergence Divergence (MACD) and the Relative Strength Index (RSI) are trending upward, signalling a strengthening of short-term bullish momentum. Nevertheless, both indicators are approaching overbought territory, which may encounter short-term resistance and temper the current ascending performance.
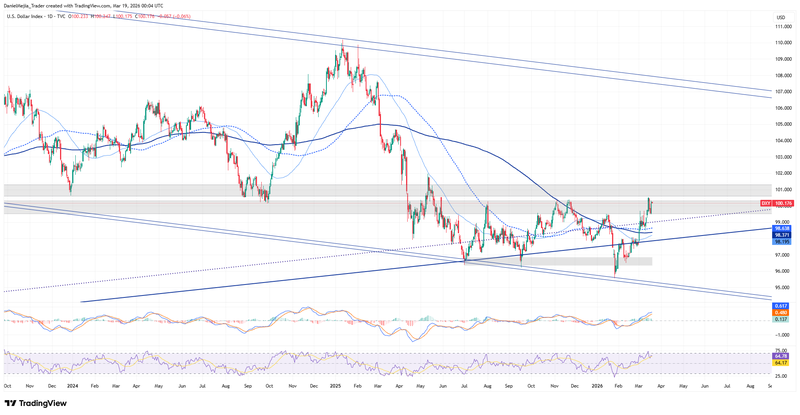
Figure 2. Dollar Index DXY (2024–2026). Source: Data from the Intercontinental Exchange (ICE); own analysis conducted via TradingView.


