Dollar slides against Euro following sharp rise in Eurozone inflation
The EUR/USD pair has reached a pivotal juncture. At the market close, the Euro appreciated against the US Dollar following a significant spike in Eurozone headline inflation, driven primarily by surging energy costs. With heightened inflationary risks likely to pressure the European Central Bank (ECB) toward a more restrictive monetary policy stance, market participants are now pricing in three interest rate hikes for the 2026 fiscal year.

Eurozone headline inflation rose from 1.9% in February to 2.5% in March, underpinned by elevated energy prices amidst escalating US-Israel-Iran tensions in the Middle East.
The ECB Governing Council faces mounting pressure to deploy restrictive monetary tools should inflationary risks persist, particularly if geopolitical conflicts in the Middle East remain unresolved.
The EUR/USD pair is currently testing a critical support level; the outcome could determine whether the long-term bullish trend resumes or if short-term downward momentum intensifies.
European inflation rate jumps in March, falling slightly short of forecasts
According to data released by Eurostat, Eurozone headline inflation accelerated from 1.9% in February to 2.5% in March. While this represents a substantial price surge—reaching its highest level since January 2025—the figure landed marginally below the consensus forecast of 2.6%. This spike was primarily driven by a 4.9% year-on-year (YoY) surge in energy costs, a direct consequence of heightened geopolitical instability involving the United States, Israel, and Iran. Reporting from Trading Economics indicates that the acceleration was most pronounced in the bloc’s largest economies: Germany climbed to 2.8% (from 2.0%), France reached 1.9% (from 1.1%), and Spain hit 3.3% (from 2.5%).
In contrast to the volatility seen in headline figures, European core inflation—which excludes volatile energy and unprocessed food costs—continued its cooling trend, decelerating from 2.4% to 2.3%. This divergence remains a critical focal point for policymakers. The central debate has now shifted toward "pass-through" costs: the extent to which firms transfer elevated energy overheads to consumers and whether labour unions will demand higher nominal wages to offset the erosion of purchasing power. Should a "wage-price spiral" materialise, it would present a significant upside risk to the medium-term inflation outlook.
Currency markets responded with a "hawkish" interpretation; the EUR/USD pair appreciated by 0.80% to reach $1.1555. Despite the slight headline miss, the underlying pressure from energy costs keeps the European Central Bank (ECB) on a potential path of monetary tightening. The Governing Council has signalled a readiness to pivot toward a more aggressive stance should energy-led inflation prove "sticky." Current market expectations, supported by Reuters reporting, suggest the ECB could raise interest rates three times in 2026, with the initial hike potentially arriving as early as the April or June meetings.
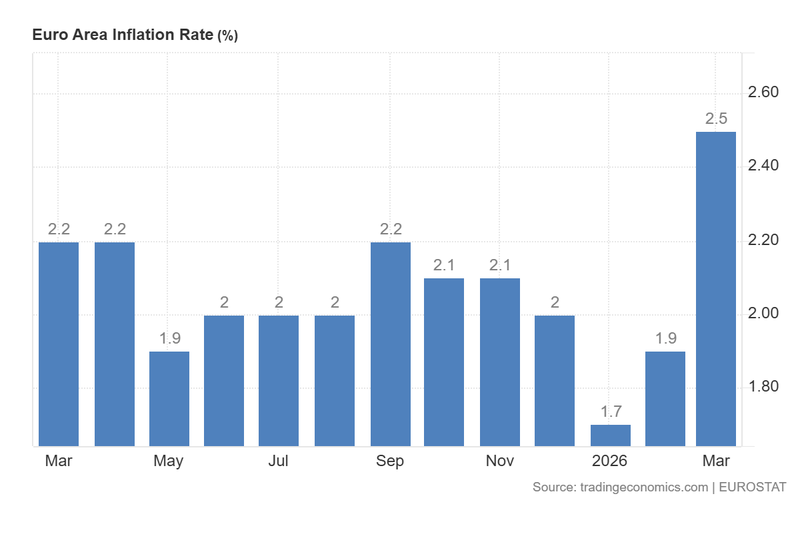
Figure 1. Euro Area Inflation Rate (2025–2026). Source: Data from Eurostat; Figure obtained from Trading Economics.
Technical analysis of the EUR/USD pair
From a technical perspective, the EUR/USD pair maintains a broad bullish posture over the long term, yet it is currently challenging a critical support zone within its short-term structure. Key observations include:
- Trend Context: Over the long term, the pair has preserved a market structure defined by higher highs and higher lows. However, the spot price is currently trading below the 50, 100, and 200-day Simple Moving Averages (SMAs). In the short term, the Euro is testing significant support levels that are being reinforced by the current fundamental appreciation.
- Resistance Levels: Should the immediate short-term resistance at $1.1680 (which coincides with the 200-day SMA) be breached, the next major technical ceiling is identified at $1.1850—a significant long-term structural resistance zone. A decisive breakout above this level would indicate the potential for a further extension toward higher valuations.
- Support Levels: If the $1.1480 support level is compromised, the next relevant floor is situated at the $1.1230 structural pivot point. A breach of the $1.1230 zone would significantly increase the probability of a deeper market correction and a shift in the medium-term outlook.
- Momentum Indicators: Both the Moving Average Convergence Divergence (MACD) and the Relative Strength Index (RSI) reflect a neutral performance, following a positive reaction from oversold territory.
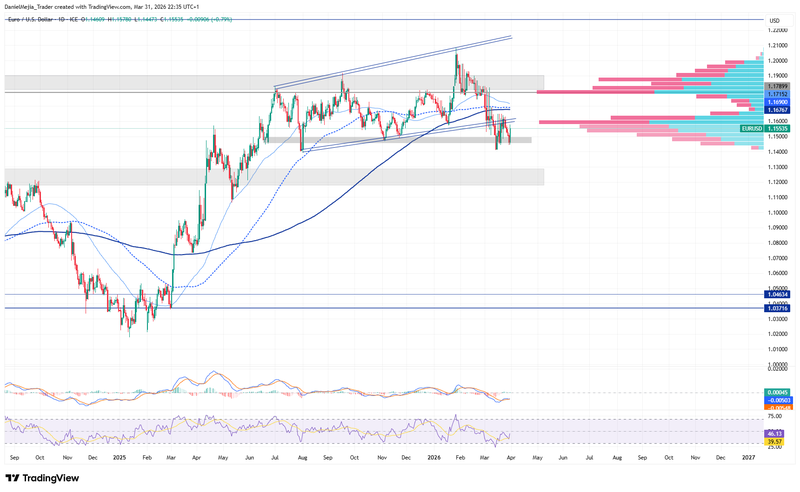
Figure 2. EUR/USD pair (2024–2026). Source: Data from the Intercontinental Exchange (ICE); own analysis conducted via TradingView.


