Dow Jones corrects amid soft labour data, yet bullish momentum persists
The Dow Jones Index (DJI) closed marginally lower following a series of mixed economic releases; however, the index maintains its long-term bullish trajectory. While the manufacturing sector remains in contraction, the services sector continues to demonstrate resilience. Despite softening labour market indicators, investor sentiment is buoyed by expectations for the Q4 earnings season and the potential for monetary easing should official employment figures continue to weaken.

ISM Manufacturing data disappointed, whereas Services PMI exceeded expectations, highlighting a decoupling between sectors.
ADP employment growth and JOLTs job openings both trended lower, reinforcing a three-year cooling period in the labour market.
The index remains near record highs, supported by optimism surrounding AI-driven corporate earnings and anticipated Federal Reserve policy shifts in 2026.
While the primary trend is bullish, bearish MACD divergence and overbought RSI levels suggest a possible short-term consolidation or corrective phase.
US economic data reveals sectoral divergence: strength in services versus weakness in manufacturing and employment
During the current week, macroeconomic data in the United States has been characterised by a notable divergence: robust expansion in the services industry contrasted against persistent fragility in the manufacturing and labour sectors. On Monday, the Institute for Supply Management (ISM) reported that the Manufacturing PMI retreated to 47.9, its lowest reading since November 2024. This contraction underscores the ongoing pressures on the industrial sector, largely attributed to the cumulative impact of tariffs and heightened geopolitical uncertainty.
Conversely, Wednesday’s Services PMI print offered a counter-narrative, reaching a peak of 54.4, its highest level since November 2024. This suggests that the services sector remains the primary engine of economic resilience.
The labour data, provided by Automatic Data Processing (ADP) and the Bureau of Labour Statistics (BLS), further compounded concerns regarding economic cooling. The ADP Employment Change reported a modest increase of 41,000 new positions for December, falling short of market expectations. Simultaneously, the BLS revealed that JOLTs Job Openings (unfilled vacancies) declined by 303,000 in November, also missing analyst forecasts. Both metrics continue a multi-year bearish trend, indicating a structural slowdown in vacancy creation and private hiring velocity.
Market participants are now pivoting their attention to the official Employment Situation Report to be released by the BLS on Friday, 9 January 2026. The non-farm payrolls and the unemployment rate will be critical in determining the Federal Reserve's policy trajectory for the coming year.
The Dow Jones remains positioned near record levels, underpinned by expectations of a possible transition toward monetary easing in 2026. Furthermore, significant optimism surrounds the upcoming Q4 earnings season (starting next week), particularly regarding firms integrated into artificial intelligence (AI) and semiconductor supply chains, which are expected to report robust financial results.
Technical analysis of the Dow Jones index
From a technical standpoint, the Dow Jones continues to respect its long-term bullish framework. Key observations include:
- Trend Context: In the long term, the index maintains a classic market structure of higher highs and higher lows. Price action remains comfortably above the 50, 100, and 200-period Simple Moving Averages (SMAs). However, the presence of short-term resistance and a notable bearish divergence on the MACD (Moving Average Convergence Divergence) suggests that the current upward momentum may face immediate headwinds.
- Resistance Levels: Should the index decisively breach the short-term resistance at 49,500, the focus will shift to the major psychological milestone of 50,000. A sustained break above this level would likely signal a further extension of the bull market into unchartered territory.
- Support Levels: To the downside, the immediate support is situated at 48,000, which converges with the 50-day moving average. A failure to hold this level would bring the medium-term floor at 45,900 into play. A breach of the 45,900 zone would significantly increase the likelihood of a deeper structural correction.
- Momentum Indicators: The MACD is currently exhibiting a bearish divergence, indicating a loss of momentum in the prevailing trend. Additionally, the Relative Strength Index (RSI) is hovering near overbought territory, suggesting the market may be due for a period of cooling.
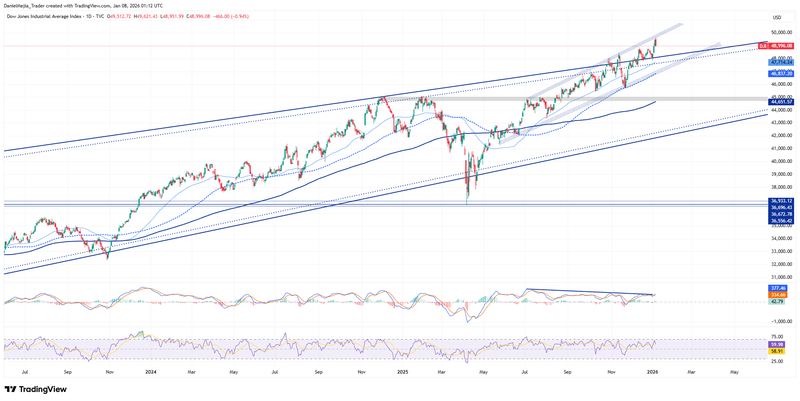
Figure 1. Dow Jones index (2024-2025). Source: Data from the NYSE Exchange; Own analysis conducted via TradingView.


