DXY strengthens on a potential hawkish Fed stance and risk-off mood
The US Dollar Index (DXY) has advanced due to a confluence of factors, most notably the rising expectations of a prolonged restrictive monetary policy from the Federal Reserve and a surge in safe-haven demand. This "risk-off" mood follows the escalating conflict in the Middle East, which has now reached its one-month mark.

The CME FedWatch Tool indicates an increasing probability of a "higher-for-longer" interest rate environment as mounting inflationary risks weigh on market sentiment.
In the wake of the US-Israel-Iran conflict, major crude oil benchmarks have surged by 35%, while the gasoline benchmark has risen by 40%, exerting a significant upward pressure on global inflation rates.
The DXY index is currently testing a prominent structural resistance level; a decisive breakout could solidify short-term bullish momentum if supported by fundamental drivers.
Shifting monetary policy expectations favour a "higher-for-longer" Federal Reserve stance
According to recent data from the CME FedWatch Tool, the market consensus now anticipates that interest rates will remain on hold for the remainder of 2026. Notably, expectations for a primary interest rate cut have been pushed back to late 2027—a stark contrast to previous forecasts which had priced in two cuts for the current year. This hawkish shift in policy outlook is a direct consequence of the US-Israel-Iran conflict in the Middle East, which has triggered a severe disruption in energy supply chains. Since the onset of hostilities on 28 February, global oil benchmarks—Brent and WTI—have appreciated by 35%, while gasoline prices have surged by approximately 40%.
Given that the sharp rise in energy costs is heightening inflationary risks amidst acute geopolitical instability, market participants are increasingly pivoting toward the US dollar as a vehicle for hedging and safety. At the most recent market close, the Dollar Index (DXY) rose 0.30% to 100.5 points, effectively testing critical resistance levels. Furthermore, the DXY has appreciated by roughly 3% over the past month, reflecting a renewed appetite for the greenback against a basket of major currencies.
Technical analysis of the Dollar index (DXY)
From a technical perspective, the Dollar Index remains positioned within a primary long-term bearish trajectory. However, the current market structure indicates a significant short-term bullish pivot:
- Trend Context: Over the medium term, the index continues to trade within a descending channel pattern. Nevertheless, the recent rally has propelled the DXY above its 50, 100, and 200-day Simple Moving Averages (SMAs). The index is currently testing a key structural resistance zone, which may serve as a launchpad for further bullish momentum.
- Resistance Levels: To the upside, the 101.00 level represents a formidable technical hurdle. A decisive breakout above this threshold would shift the market's focus toward the 104.0 handle. A sustained move above 104.0 would signal a major transition into a higher, more aggressive trading range.
- Support Levels: On the downside, immediate support is identified at 98.5, a level in close proximity to the 200-day SMA. Should this floor be breached, the next critical area of interest is 96.5, representing significant short-term structural support. A failure at the 96.5 level would likely facilitate a deeper bearish correction.
- Momentum Indicators: Both the Moving Average Convergence Divergence (MACD) and the Relative Strength Index (RSI) are trending upwards, indicating a strengthening of short-term bullish pressure. However, as both indicators approach overbought territory, the role of macroeconomic fundamentals will be pivotal in determining the sustainability of further technical gains.
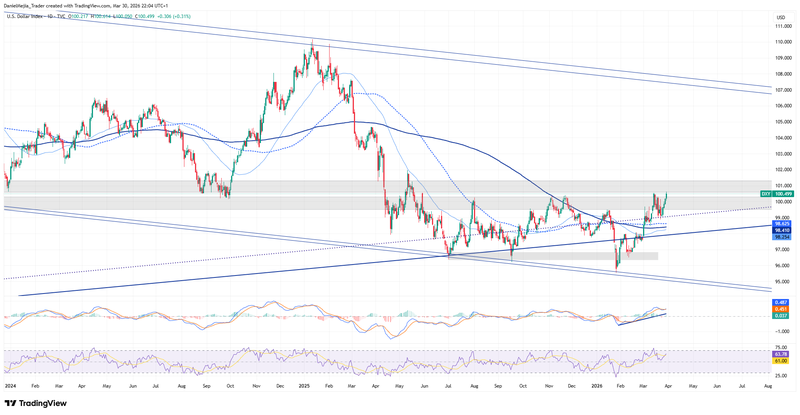
Figure 1. Dollar Index DXY (2024–2026). Source: Data from the Intercontinental Exchange (ICE); own analysis conducted via TradingView.


