Gold futures rally toward $4,500 amid geopolitical risks
Gold futures are currently trading near the $4,500 threshold, representing a historic milestone in the precious metal's market capitalisation. This unprecedented surge reflects a broader shift in global sentiment as market participants seek protection against escalating systemic risks.

The gold futures contract appreciated by 1.87 per cent at market close, surpassing the $4,400 mark for the first time in history amidst a flight to safety.
Having breached its previous record high, the contract is now testing psychological resistance near $4,500 per ounce.
A combination of shifting monetary policy expectations and heightened geopolitical risk premiums continues to underpin the current bullish momentum.
Gold prices surge amid escalating US-Venezuela tensions
The gold futures contract (GCG26) concluded the session with a 1.87 per cent increase, reaching $4,469 per ounce. Intraday performance shows the metal testing the $4,500 level for the first time in its history. This rally coincides with a sharp escalation in geopolitical friction between the United States and Venezuela, following a series of maritime seizures by U.S. forces along the Venezuelan coastline.
Gold remains a cornerstone for central bank reserves, institutional investors, and hedgers. However, a unique convergence of fundamental drivers has recently intensified demand. Firstly, the probability of two interest rate cuts in 2026 by the Federal Reserve remains high—according to the CME Group’s FedWatch Tool—supported by the cooling inflation data recently published by the Bureau of Labour Statistics.
Secondly, the deterioration of diplomatic relations between Washington and Caracas has injected a significant geopolitical risk premium into the market. This has further bolstered the valuation of gold, which remains the quintessential safe-haven asset during periods of international instability.
Last week, U.S. President Donald Trump mandated a blockade of all sanctioned oil tankers entering or exiting Venezuelan waters. Following the initial seizure of one vessel, two additional ships were detained by the U.S. Navy over the weekend; precise details regarding the current status of these vessels remain unavailable.
Compounding these tensions, the Chinese Foreign Ministry stated:
"U.S. interceptions of ships have constituted a serious violation of international law."
This rhetoric elevates the risk of a broader diplomatic confrontation involving major global powers. Given that China remains Venezuela's largest crude oil purchaser, accounting for approximately 4 per cent of its exports, any disruption to these maritime routes carries significant economic and diplomatic weight.
Technical analysis of gold
From a technical perspective, gold futures maintain a robust long-term bullish trajectory. Key observations include:
- Trend Context: In the long term, gold maintains a clear market structure defined by higher highs and higher lows. The price continues to respect its primary moving averages (50, 100, and 200 periods). Notably, the price has decisively broken above the previous record resistance of $4,360.
- Resistance Levels: Should the $4,500 psychological barrier be breached to the upside, the next significant ceiling is identified at $4,600. A sustained move above these levels would suggest a potential extension into uncharted price territory.
- Support Levels: If the short-term support at $4,370 is invalidated, the next structural floor is located at $4,000—a major psychological level that aligns closely with the 100-day moving average. A breach of the $4,000 zone would increase the likelihood of a significant market correction.
- Momentum Indicators: The Moving Average Convergence Divergence (MACD) is showing renewed strength, confirming the bullish impulse. Meanwhile, the Relative Strength Index (RSI) is currently oscillating within overbought territory but continues to form higher highs, indicating that the trend remains strong despite the extension.
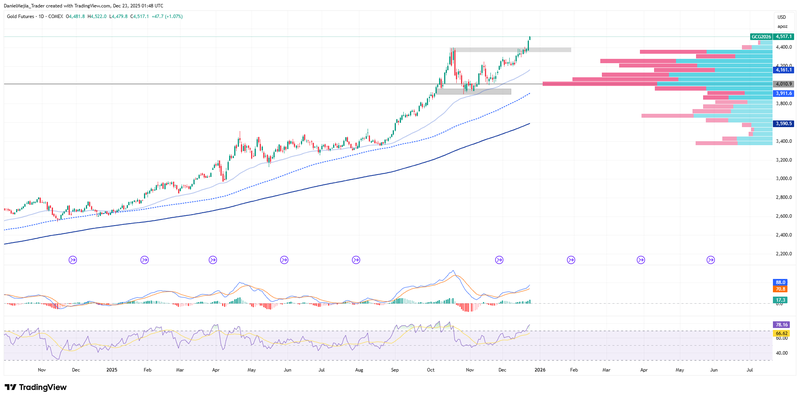
Figure 1. Gold Future Contract GCG26 (2024–2025). Source: Data from the COMEX Exchange; own analysis conducted via TradingView.


