Gold nears $5,000 per ounce as global instability drives safe-haven demand
Gold futures contract GCG26 is approaching the significant $5,000 psychological milestone, propelled by escalating geopolitical tensions and mounting concerns regarding the institutional independence of the Federal Reserve. The precious metal continues to serve as the primary global hedge against systemic risk.

Gold prices are trading near record highs, having accumulated a 14% return year-to-date as investors pivot toward defensive assets.
Despite a tentative de-escalation in trade rhetoric at the World Economic Forum, the diplomatic standoff over Greenland’s sovereignty remains a primary source of market volatility.
Legal challenges and political pressure on the Federal Reserve Board of Governors have sparked fears of a "credibility gap," further incentivizing capital flight into bullion.
While momentum indicators suggest the market is overbought, robust volume signals indicate that the rally is underpinned by fundamental safe-haven demand rather than mere speculation.
Gold futures contracts approach $5,000 amidst geopolitical and institutional instability
The benchmark gold futures contract (GCG26) is currently testing close to the $5,000 per ounce threshold, a prominent psychological barrier. This surge is driven by a confluence of high geopolitical uncertainty and growing apprehension regarding the autonomy of the US Federal Reserve.
Although trade tensions between the United States and the European Union appeared to ease during the World Economic Forum in Davos, Switzerland, underlying volatility persists. A "framework for a future deal" regarding the Greenland territory was recently proposed by US President Donald Trump following meetings with NATO leadership. However, both Denmark and Greenland have remained emphatic that the island’s sovereignty is not a matter for negotiation. This ongoing diplomatic dispute between Washington and its European allies continues to weigh on investor sentiment, sustaining the bid for gold.
Simultaneously, institutional pressures on the Federal Reserve have intensified. The financial community is closely monitoring legal proceedings involving Chairman Jerome Powell and Governor Lisa Cook. With the Supreme Court currently weighing the executive branch's power to remove Fed officials "for cause," market participants are increasingly concerned that political interference could compromise monetary policy. As the independence of the Federal Open Market Committee (FOMC) is called into question, gold has benefited significantly, reaffirming its status as the pre-eminent safe-haven asset in global financial markets.
Technical analysis of gold
From a technical perspective, gold futures maintain a robust long-term bullish trajectory. A detailed analysis of the current market structure reveals several key observations:
- Trend Context: On the daily timeframes, gold exhibits a clear market structure defined by a series of "higher highs" and "higher lows." Prices remain significantly above the primary 50, 100, and 200-period moving averages, confirming the underlying strength of the current trend.
- Resistance Levels: Should the $5,000 psychological barrier be breached, the next significant technical ceiling is identified at $5,100. A sustained move above these levels would signal a potential extension into uncharted price territory.
- Support Levels: In the event of a pullback, the immediate short-term support sits at $4,560. If this level is invalidated, the next structural floor is located at $4,375. A breach of the $4,375 zone would heighten the probability of a major market correction.
- Momentum and Volume: Momentum indicators, including the Moving Average Convergence Divergence (MACD) and the Relative Strength Index (RSI), show increasing upward pressure; however, both are currently trading in overbought territory. Crucially, the Volume Profile and contract volumes indicate that demand remains consistent, suggesting that fundamental hedging requirements are supporting the price action.
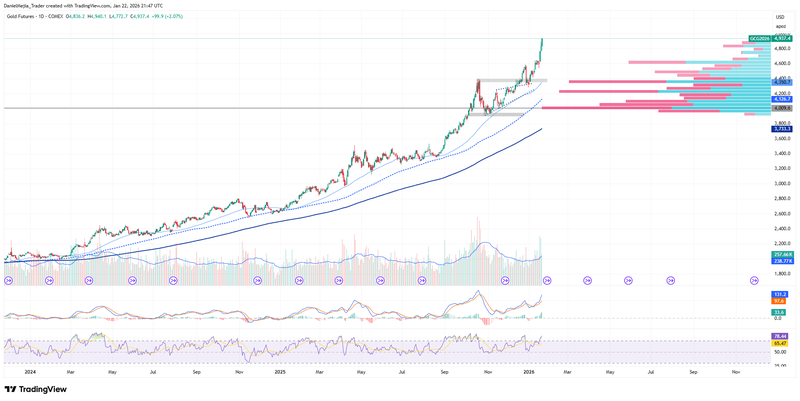
Figure 1. Gold Future Contract GCG26 (2024–2026). Source: Data from the COMEX Exchange; own analysis conducted via Trading View.


