Japan inflation undershoots forecasts as Nikkei falls below key level
The Nikkei 225 index has declined by approximately 11% from its recent record high, driven by escalating geopolitical tensions surrounding the US-Israel-Iran conflict. Despite a significant deceleration in the Japanese inflation rate, the Bank of Japan (BoJ) remains prepared to adopt a hawkish stance should inflationary pressures re-emerge.

Headline inflation in Japan decelerated from 1.5% to 1.3%, while the core inflation rate eased from 2% to 1.6%—falling short of market analyst projections.
The latest report indicates that the most significant price decreases occurred in the electricity and gas sectors; however, these figures do not yet account for the recent surge in global energy prices.
Amidst heightened geopolitical and economic uncertainty, the Nikkei 225 has breached its medium-term upward trend line to the downside, with short-term momentum indicators signalling a strengthening bearish impulse.
Japanese inflation decelerates to a four-year low
According to data released by the Ministry of Internal Affairs and Communications of Japan, the headline inflation rate moderated from 1.5% in January to 1.3% in February—its lowest level since March 2022. Concurrently, the core inflation rate—which excludes volatile fresh food and energy costs—decelerated from 2% to 1.6%, missing the consensus estimate of 1.7%. Information from Trading Economics reveals that the most significant downward contributions to the headline indicator were from electricity (falling from -1.7% in January to -8% in February) and gas (from -2% to -5.1%).
While the inflation data reflects a relevant easing that could theoretically reduce pressure on the Bank of Japan’s (BoJ) upcoming monetary policy decisions, these evaluations do not yet incorporate higher energy costs resulting from the conflict in the Middle East. Over the past month, crude oil prices have increased by approximately 40%, while gasoline prices have risen by roughly 35%. Furthermore, several Liquified Natural Gas (LNG) benchmarks have jumped considerably following the closure of the Strait of Hormuz during the US-Israel-Iran confrontation.
Last week, the Bank of Japan elected to maintain its policy rate benchmark at 0.75%. However, the central bank explicitly stated that it would implement a more restrictive (hawkish) stance if resurgent energy prices were to push inflation back above its 2% target.
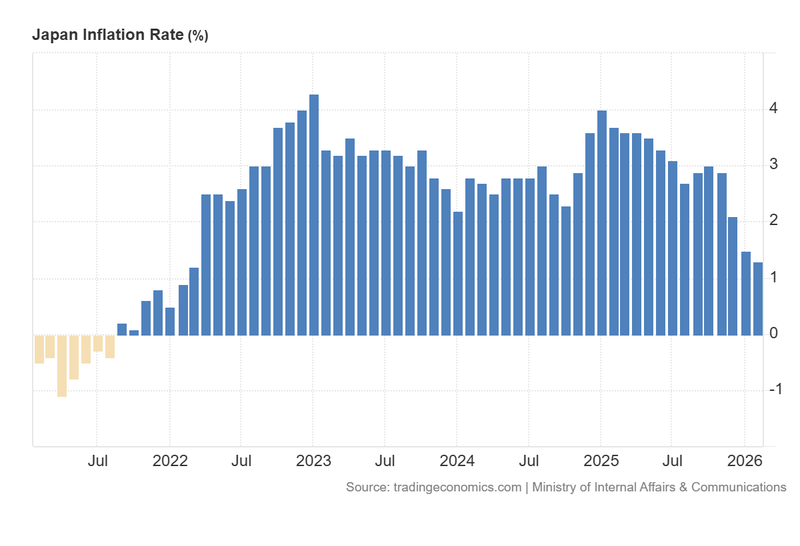
Figure 1. Japan Inflation Rate (2021–2026). Source: Data from the Ministry of Internal Affairs & Communications; Figure obtained from Trading Economics.
Technical analysis of the Nikkei 225 index
From a technical perspective, the Nikkei 225 continues to demonstrate a robust long-term bullish trajectory. A detailed analysis of the current market structure reveals the following key observations:
- Trend Context: Over the long term, the index remains in a clear uptrend, characterised by a structural sequence of "higher highs" and "higher lows". Prices are currently trading above the 200-day Simple Moving Average (SMA), confirming strong underlying momentum. However, in the short term, the index is breaching an upward trend line, while momentum indicators signal a rising strength in the bearish impulse.
- Resistance Levels: Should the index breach the short-term resistance at 55,000, the next significant level is identified at the record high of 58,875. A decisive close above this level would signal a potential extension into uncharted price territory.
- Support Levels: If the current contraction persists, short-term support is established at 48,500 (a level that aligns closely with the 200-day SMA). Should this level be invalidated, the next structural floor is located at 40,000. A breach of the 40,000 zone would significantly heighten the probability of a deeper market correction.
- Momentum Indicators: Both the Moving Average Convergence Divergence (MACD) and the Relative Strength Index (RSI) are exhibiting downward trends, suggesting that the current short-term bearish impulse could persist or lead to a period of consolidation. Notably, the MACD movement has been preceded by a bearish divergence, which often serves as a warning of trend exhaustion.
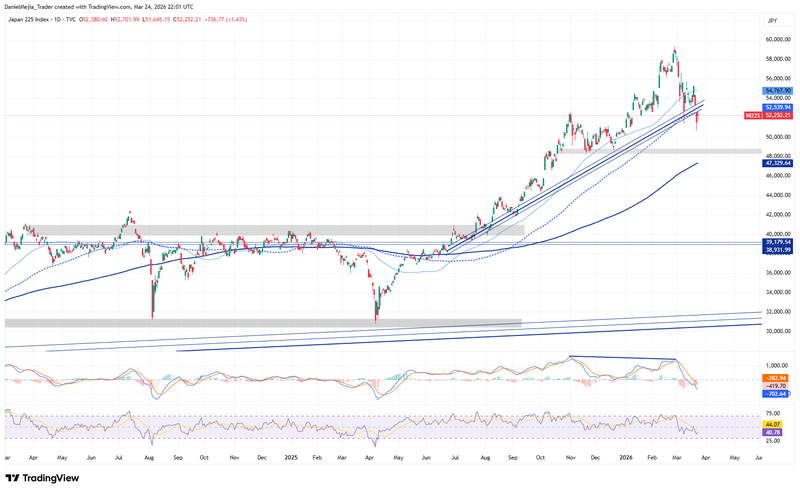
Figure 2. Nikkei 225 Index (2024–2026). Source: Own analysis conducted via TradingView.


