Nikkei hits record high as retail sales and industrial output accelerate
The Nikkei 225 index has reached a new historical milestone following the release of robust economic data concerning retail sales and industrial production. These indicators suggest a strengthening macroeconomic environment in Japan, bolstering investor confidence in the region's equity markets.

Japanese retail sales surged by 4.1% in January on a month-on-month (MoM) basis, marking the highest growth rate in five years.
Industrial production rose by 2.2% MoM, with significant contributions from the motor vehicle, plastics, organic chemicals, and medicine sectors.
While the Nikkei 225 maintains a definitive long-term bullish trajectory, short-term momentum indicators—specifically the MACD and RSI—are approaching overbought levels, indicating a possible near-term pause.
Japanese retail sales and industrial production accelerate in tandem
According to data released by the Ministry of Economy, Trade and Industry (METI), Japanese retail sales grew by 4.1% in January (MoM), the strongest performance recorded in five years. This result effectively reversed the 2% contraction observed in December, signalling a significant recovery in domestic consumption. On a year-on-year (YoY) basis, retail sales growth accelerated to 1.8%, representing its most robust performance since August 2025.
Concurrently, industrial production expanded by 2.2% MoM in January, pushing the YoY reading to 2.3%. This monthly increase halted a two-month period of decline, marking a pivotal improvement for Japanese industry. As reported by Trading Economics, the most significant sectoral gains were observed in motor vehicles (+9.1% in January vs +1.4% in December), plastic products (+7.4% vs 0%), and the organic chemicals and medicine sectors (+7.4% vs -3%).
In response to these developments, the Nikkei 225 index climbed 0.16% to reach a record high of 58,850 points. Market participants have interpreted the latest data as an optimistic signal for overall economic growth, underpinning the current rally in Japanese equities.
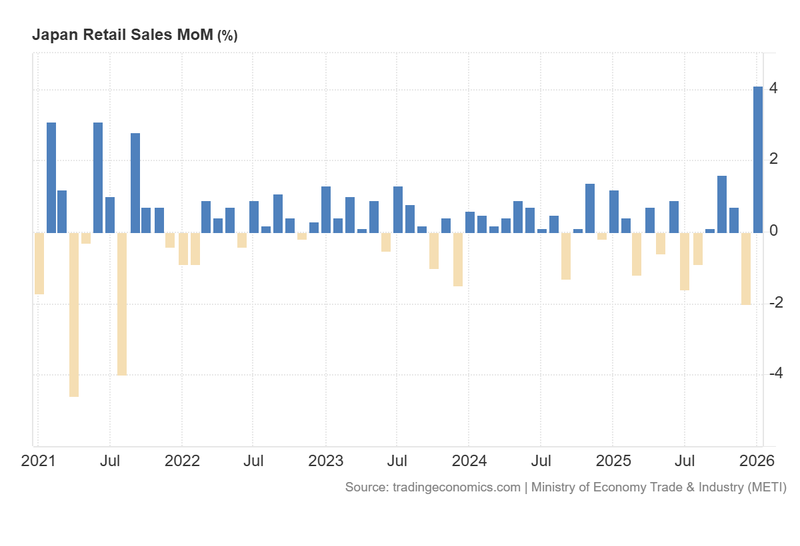
Figure 1. Japan Retail Sales (2021–2026). Source: Data from the Ministry of Economy, Trade & Industry (METI); Figure obtained from Trading Economics.
Technical analysis of the Nikkei 225 index
From a technical perspective, the Nikkei 225 continues to demonstrate a robust long-term bullish trajectory. Key observations include:
- Trend Context: Over the long term, the index remains in a clear uptrend, characterised by a structural sequence of "higher highs" and "higher lows". Prices are currently trading significantly above the primary 50, 100, and 200-period Simple Moving Averages (SMAs), confirming strong underlying momentum.
- Resistance Levels: Should the index breach the 60,000 historical threshold, the next immediate psychological resistance is identified at 62,000. A decisive close above this level would signal a potential extension into uncharted price territory.
- Support Levels: In the event of a pullback, the short-term support is established at 56,500. Should this level be invalidated, the next structural floor is located at 52,500—a zone that aligns with a bullish trend line and the 100-period SMA. A breach of this 52,500 zone would significantly heighten the probability of a deeper market correction.
- Momentum Indicators: Both the Moving Average Convergence Divergence (MACD) and the Relative Strength Index (RSI) are currently oscillating within overbought zones. This suggests that while the prevailing trend remains strong, the pace of the rally may face a near-term slowdown or period of consolidation.
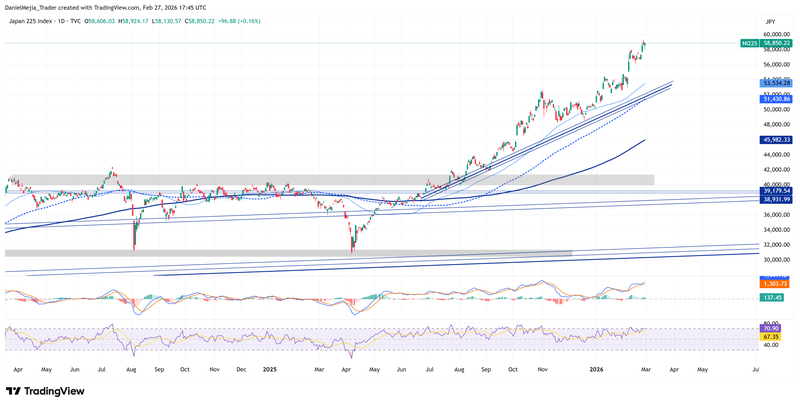
Figure 2. Nikkei 225 Index (2024–2026). Source: Own analysis conducted via TradingView.


