Potential U.S. dollar rebound: DXY outlook & economic strength
In this article, we will analyze the current context of the U.S. economy and the performance of the U.S. Dollar Index throughout 2025.

The U.S. Dollar Index has declined by approximately 10% so far in 2025, even though the U.S. economy has demonstrated resilience.
While the economy continues to display strength and the Federal Reserve maintains benchmark interest rates at elevated levels, the currency’s value has continued to erode.
Uncertainty over trade policy and a recent downgrade in the U.S. credit rating have weighed on the dollar’s performance.
Despite the depreciation, technical analysis is beginning to signal a potential short-term reversal
What has happened to the U.S. dollar index in recent months?
The U.S. Dollar Index (DXY) has fallen by roughly 10% from its January 2025 peak. However, this depreciation trend raises deeper questions. The U.S. Dollar Index is a benchmark that measures the intrinsic value of the U.S. dollar against a basket of major developed-market currencies, including the euro, Japanese yen, British pound, Canadian dollar, Swedish krona, and Swiss franc (ICE, 2025). One of its primary purposes is to assess the strength of the U.S. dollar relative to currencies of highly developed economies within the basket. A gradual appreciation of the index typically reflects a depreciation of its counterpart currencies, whereas a decline in the index generally signals the opposite. As mentioned earlier, year-to-date (YTD) the dollar has posted a sharp depreciation, while the currencies with the most notable gains have been the euro (+12%), Swiss franc (+11%), and Swedish krona (+12%).
However, an unusual dynamic has pushed the DXY to multi-month lows despite the fact that the U.S. economy:
- has remained economically robust, and
- has pursued a more restrictive monetary policy stance.
On the economic front, U.S. GDP growth, measured quarterly, has averaged 2.44% over the past three years—an impressive figure given that developed economies are finding it increasingly challenging to expand (see chart below). Meanwhile, the unemployment rate remains near historic lows at 4.2%. This backdrop has enabled the Federal Reserve to keep its benchmark interest rate at 4.5%, as inflation still stands above the 2% target.
Typically, a restrictive policy environment leads to gradual currency appreciation—particularly when central banks in peer economies adopt a more accommodative stance—mainly because higher yields create greater investment appeal. This is precisely the current situation: the European Central Bank maintains a policy rate of 2.15%, the Bank of Japan 0.5%, the Bank of England 4%, the Bank of Canada 2.75%, the Bank of Sweden 2%, and the Swiss National Bank 0% (Trading Economics, 2025). In every case, policy rates remain below those of the United States.
The chart below illustrates how, when the economies in the comparison group have faced contractions or slowdowns in GDP, the U.S. has generally maintained stronger performance (dark blue solid line). Conversely, when these economies have seen sharp growth spikes, U.S. GDP growth has remained relatively stable.
Figure 1. GDP comparison among countries included in the U.S. Dollar Index basket (2022–2025)
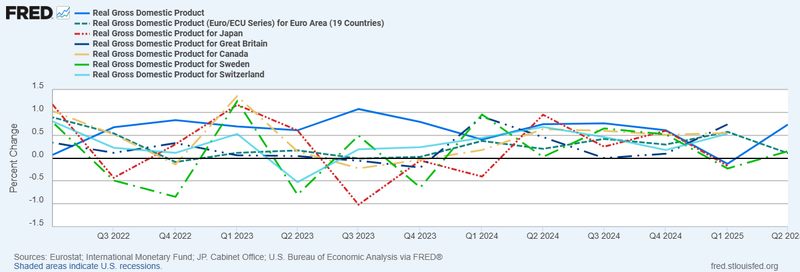
Source: U.S. Bureau of Economic Analysis, Real Gross Domestic Product, retrieved from FRED, Federal Reserve Bank of St. Louis (August 2025)
What has affected the intrinsic value of the U.S. dollar?
Several factors have weighed on the dollar’s value, most notably: economic uncertainty stemming from the trade policies implemented by U.S. President Donald Trump, and the downgrade of U.S. sovereign credit ratings by the three major rating agencies—S&P Ratings, Fitch Ratings, and Moody’s Credit Rating.
The trade policy agenda has significantly impacted growth expectations and the macroeconomic stability of the United States. The administration has introduced so-called reciprocal tariffs on U.S. imports, alongside sector-specific tariffs targeting industries such as automotive, and tariffs on several strategic commodities including steel, aluminum, and semi-fabricated copper products. Additional threats of tariffs have also been directed toward industries such as pharmaceuticals and semiconductors. These measures have undeniably eroded the United States’ credibility as a trade partner, while dampening investment and consumption prospects across numerous supply chains.
For instance, U.S. consumer confidence has declined since Donald Trump beginning administration, while hiring—measured by the nonfarm payroll’s indicator—has shown a clear downward trend over the same period. The ultimate economic impact of these tariff measures remains uncertain, particularly as the President continues to deploy trade policy not only as an economic tool but also as a high-impact geopolitical instrument.
On the leverage risk front, in May 2025, Moody’s downgraded the U.S. long-term sovereign credit rating from the top-tier Aaa to Aa1, citing concerns about over indebtedness and fiscal deficit risks. This move aligns Moody’s with S&P and Fitch, which issued similar downgrades in 2011 and 2023, respectively.
The warning is explicit: high fiscal deficits and rising interest costs are beginning to erode the fiscal health of the U.S., while the nation becomes increasingly reliant on debt to sustain its economic growth. As of August 2025, U.S. public debt stands at $37.2 trillion (U.S. Debt Clock), and projections suggest an increase of between $3 trillion and $5 trillion over the coming years. Such growth would significantly worsen the fiscal deficit and raise interest expenses.
The chart below illustrates how the United States recorded a budget deficit of nearly 6% of GDP in 2024—well above the 70-year historical average of 2.57% (Trading Economics, August 2025).
Figure 2. US Government Budget (% of GDP)
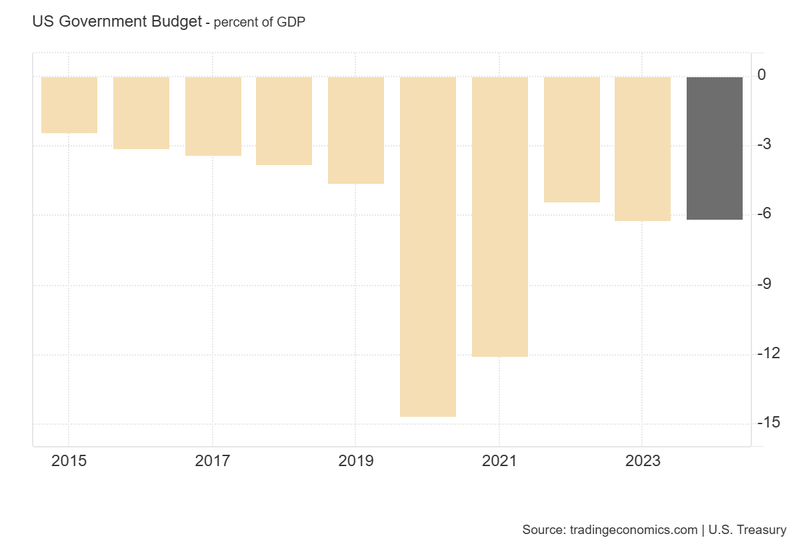
Source: Chart extracted from the Trading Economics portal (August 2025)
Long-term technical outlook for the U.S. dollar index
From a technical analysis perspective, the following chart shows that the U.S. Dollar Index is currently positioned between significant supply and demand zones on the long-term chart. Although the index has trended lower in recent months, there is an upward trendline acting as a support base for the bullish outlook. However, there are also key resistance levels that the index would need to break above in order to resume its upward trajectory. These include short-term resistance at the 100.5-point level and the 200-period moving average, which is currently positioned above the price (the chart timeframe is in weekly candles).
Accordingly, the key support level to maintain is around 97 points, representing the most recent swing low. Below that, the next substantial support lies considerably lower, near the 90-point mark. On the upside, the relevant resistance to overcome is at 100.5 points, with the next resistance above that at approximately 103 points—corresponding to a 50% Fibonacci retracement from the last major downward move.
Figure 3. Dollar Index performance (2012-2025)
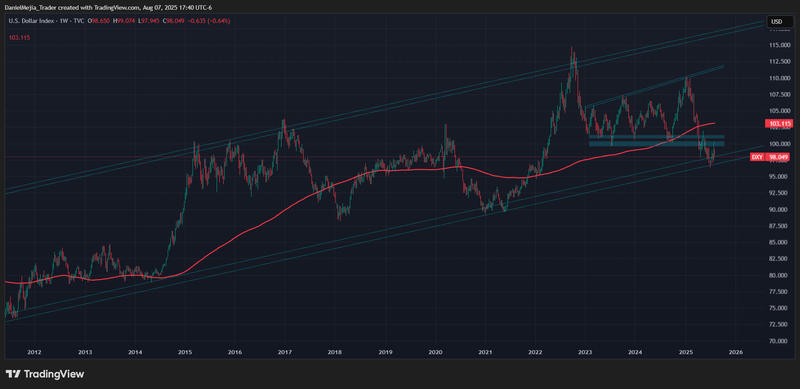
Source:TradingView (August 2025)
In the short-term bullish view, the U.S. Dollar Index could be supported by the ongoing strength of the U.S. economy, as well as by a monetary policy stance that remains restrictive. Additionally, the index’s technical structure reflects a long-term upward trend.
However, risks stemming from the aggressive trade policy implemented by Donald Trump, along with concerns over fiscal health deterioration due to high indebtedness, could weigh on the index’s value. Although the U.S. dollar retains its dominance as the world’s primary reserve currency, growing investor mistrust could have a negative impact on its value in the medium and long term.


