S&P 500 attains record high following robust Q3 GDP revision
The S&P 500 index reached a new all-time high following a significant upward revision of third-quarter GDP data, underscoring the enduring resilience of the US economy. This optimism was further bolstered by industrial production reaching a three-year peak upon the latest data update.

US Q3 GDP was revised upwards to 4.3%, representing its strongest performance since the fourth quarter of 2023.
US industrial production accelerated to 2.5% year-on-year, marking its highest level in three years.
Market expectations for monetary easing in 2026 remain firm, notwithstanding the strength of the underlying economic data.
Despite the prevailing bullish trend, technical momentum indicators—specifically the MACD and RSI—exhibit bearish divergences, suggesting a potential exhaustion of the current upward impulse.
US Q3 GDP revised higher exhibiting economic resilience; monetary easing expectations for 2026 remain in force
According to the latest figures from the Bureau of Economic Analysis (BEA), the US economy demonstrated accelerating growth, with Gross Domestic Product (GDP) rising from 3.8% in the second quarter to 4.3% in the third. This figure represents the strongest expansion since late 2023 and significantly exceeded analysts' forecasts of a 3.3% adjustment. The US economy continue to exhibit robust health, primarily driven by resilient consumer spending, which has remained steadfast despite a softening in sentiment indicators.
Complementing this growth, Federal Reserve data indicates that industrial production has recovered strongly following the disruptions caused by the recent government shutdown. Year-on-year production rose from 1.9% in September to 2.5% in November, reaching its highest level in three years. Conversely, the Census Bureau reported that durable goods orders contracted by 2.2% in October; however, this decline remains modest relative to the three-year average and does not suggest a significant historical deviation.
While a buoyant economy might typically provide the Federal Reserve with a rationale to maintain a hawkish monetary policy stance, market sentiment remains dovish. According to the CME Group’s FedWatch Tool, the probability of two 25-basis-point interest rate cuts in 2026 remains intact. This persists despite the fact that the US central bank’s latest economic outlook update accounted for only a single cut.
The primary US equity benchmarks—the S&P 500, Dow Jones Industrial Average, and Nasdaq—rose in tandem. This synchronised rally was fuelled by the dual catalysts of strong macroeconomic indicators and the prevailing investor consensus that the central bank’s monetary easing cycle is not yet exhausted.
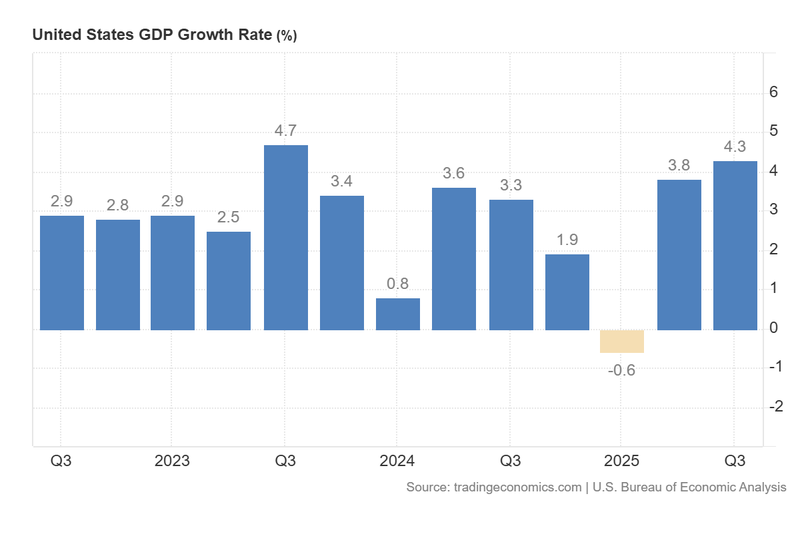
Figure 1. United States GDP Growth Rate (2022-2025). Source: Data from the US Bureau of Economic Analysis; figure obtained via Trading Economics.
Technical analysis of the S&P 500 index
From a technical perspective, the S&P 500 index maintains its long-term bullish trajectory, with price action continuing to respect primary moving averages. Key observations include:
- Trend Context: Over the long term, the S&P 500 retains a market structure defined by a sequence of higher highs and higher lows. The index is trading comfortably above its 50, 100, and 200-period moving averages, reinforcing the bullish sentiment. However, the MACD and RSI suggest a loss of momentum, specifically regarding the impulse that commenced in the second half of 2025.
- Resistance Levels: Should short-term resistance at 6,900 be breached to the upside, the next significant technical ceiling is the major psychological threshold of 7,000. A decisive move above these levels would indicate the potential for further extension into uncharted territory.
- Support Levels: If the short-term support at 6,550 is invalidated, the next critical floor is situated at 6,115. This level acts as a structural long-term support and aligns closely with the 200-day moving average. A breach of the 6,115 zone would increase the probability of a more profound market correction.
- Momentum Indicators: The Moving Average Convergence Divergence (MACD) displays a clear bearish divergence, signaling a potential waning of the prevailing trend. Furthermore, the Relative Strength Index (RSI) is forming a series of lower highs while hovering near overbought territory, suggesting the index may be vulnerable to a near-term pullback.
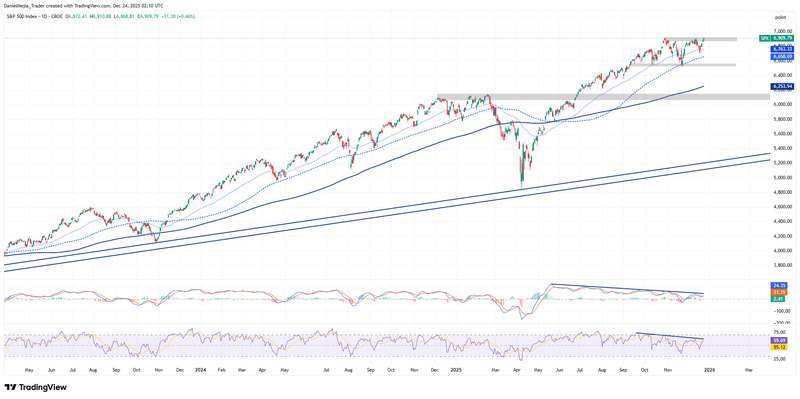
Figure 2. S&P 500 Index (2024-2025). Source: Data from the CBOE; Own analysis conducted via TradingView.


