A simple guide to Japanese Candlesticks
How they help traders make Better Decisions

Provides deeper insight than simple line charts
Helps identify trends
Confirms support and resistance levels
Candlesticks show more than just price; they reveal market sentiment through the open, high, low, and close
If you’re stepping into trading, understanding Japanese candlesticks is a game-changer. These charts provide traders with a visual representation of market price movements, making it easier to spot trends, reversals, and key trading opportunities. In this guide, we’ll break down what Japanese candlesticks are, how to read them, and how they can improve your trading strategy.
What is a Japanese Candlestick?
A Japanese candlestick is a type of price chart used in trading to represent the open, high, low, and close prices of an asset within a specific time frame. Each candlestick consists of two main parts:
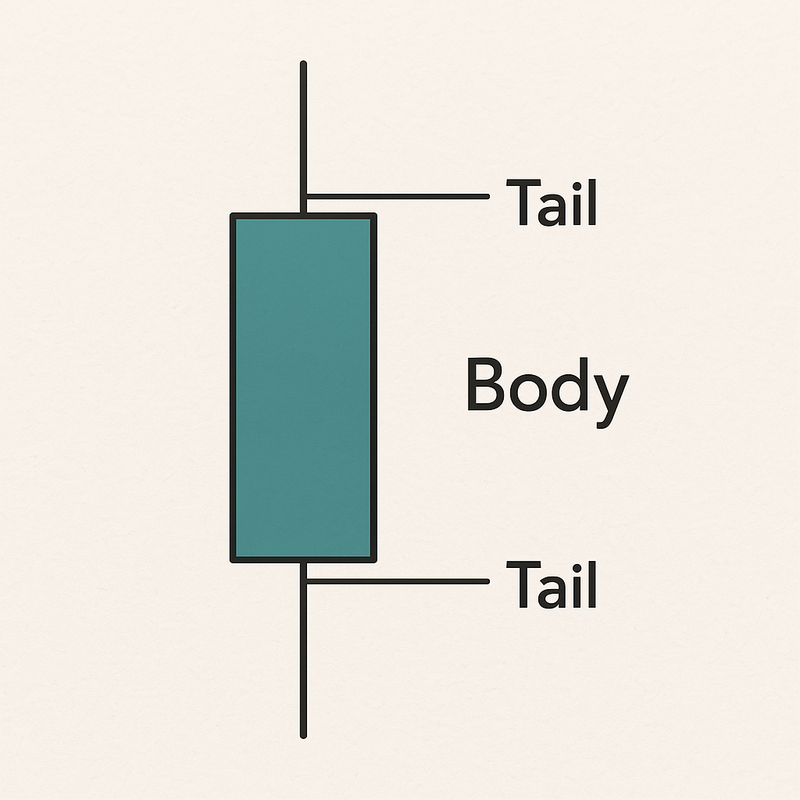
- The Body – Shows the difference between the opening and closing prices. A green or white body indicates a bullish move (price closed higher than it opened), while a red or black body represents a bearish move (price closed lower than it opened).
- The Wicks (Shadows) – The thin lines extending from the body show the highest and lowest prices reached during the time frame.
By looking at multiple candlesticks in a row, traders can analyze price patterns and predict potential market moves.
Why Do Traders Use Japanese Candlesticks?
Japanese candlestick trading is popular because it provides key insights into market sentiment, allowing traders to:
- Identify trends (uptrend, downtrend, sideways market)
- Spot reversals before they happen
- Find entry and exit points for trades
- Confirm support and resistance levels
Unlike simple line charts, Japanese candlestick charts show more details about how prices move, making them ideal for technical analysis.
How to Read Japanese Candlesticks?
Each Japanese candle stick tells a story about price action. Here are three common scenarios:
- Long Green (Bullish) Candle: Buyers are in control, and the price is likely to continue upward.
- Long Red (Bearish) Candle: Sellers dominate, suggesting further downward movement.
- Small Body (Doji): Indicates indecision, meaning the market could reverse or consolidate.
By understanding these signals, traders can make informed trading decisions.
Most Popular Japanese Candlestick Patterns
Certain Japanese candlestick patterns help traders anticipate price movements. Here are some of the most useful ones:
- Bullish Reversal Patterns
- Hammer: A small body with a long lower wick suggests a potential uptrend.
- Engulfing Bullish: A large green candle fully covers the previous red candle, signaling strong buying pressure.
- Morning Star: A three-candle pattern that signals a shift from bearish to bullish momentum.
- Bearish Reversal Patterns
- Shooting Star: A small body with a long upper wick signals potential downward movement.
- Engulfing Bearish: A large red candle fully engulfs the previous green candle, indicating selling pressure.
- Evening Star: A three-candle pattern that suggests a shift from bullish to bearish momentum.
- Continuation Patterns
- Doji: A neutral pattern that suggests the market is at a turning point.
- Spinning Top: Indicates indecision in the market and possible trend continuation.
Tips for Using Japanese Candlestick Charts in Trading
To maximize the benefits of Japanese candlestick charts, consider these tips:
- Combine with Other Indicators: Use candlestick patterns alongside moving averages, RSI, and support/resistance levels for better accuracy.
- Look for Confirmation: A single candlestick may not be enough; wait for multiple signals before making a trade.
- Trade with the Trend: Candlestick patterns work best when used within a trend rather than trying to predict reversals too early.
- Practice with a Demo Account: Before trading real money, test different candlestick patterns on a demo account to build confidence.
Final Thoughts
Japanese candlesticks provide traders with a visual and intuitive way to analyze the market. Whether you’re a beginner or an experienced trader, learning how to read Japanese candlestick charts can give you a significant edge in trading. By mastering Japanese candlestick trading, you can make smarter decisions and increase your chances of success in the financial markets.
Now that you know how to use Japanese candlesticks, start applying them to your trading strategy and watch your analysis improve!


