Falling wedge pattern: how to identify and trade it
The falling wedge is a bullish chart pattern that often appears during downtrends or consolidations, signaling selling pressure is weakening and a reversal—or continuation higher—may be near.

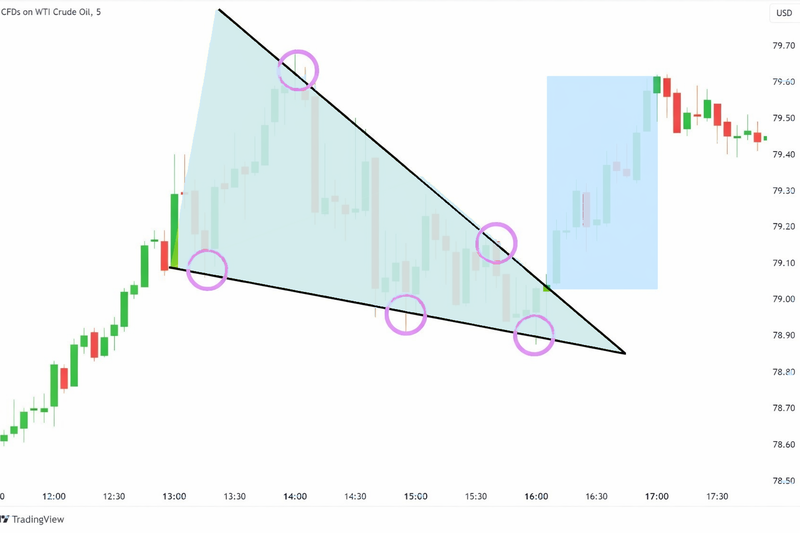
Bullish bias despite falling prices.
Converging, downward-sloping trendlines.
Breakout above resistance confirms.
Targets use the wedge’s height.
What the falling wedge pattern is
A falling wedge forms when price makes lower highs and lower lows, but the range contracts as the two trendlines converge. The upper trendline falls faster than the lower one, showing sellers are losing momentum. Although price is drifting down, the structure hints that downside energy is drying up. In technical analysis, that compression is the tell: once buyers step in, price can break upward decisively.
Market psychology behind the pattern
Early in the wedge, sellers remain active, pushing price lower. As the pattern matures, each push achieves less. Rallies still fail, but declines grow shallower. This imbalance—less progress on the downside—suggests supply is being absorbed. By the time price approaches the wedge’s apex, even modest demand can tip the balance and trigger a breakout.
Where it appears (and why context matters)
Falling wedges show up in two common places.
- After a decline: acting as a bullish reversal when a downtrend exhausts.
- Within an uptrend: acting as a bullish continuation during a pullback.
Context matters. A falling wedge breaking higher with the higher-timeframe trend tends to perform better than one fighting it.
How to identify a valid falling wedge
Start with structure, not indicators. You want two clean, downward-sloping lines that converge. The pattern should contain at least five touches in total (two on one side, three on the other). Volume often contracts during formation, reinforcing the idea of fading participation. Avoid wedges that are too wide or lack symmetry—those are often just channels.
Confirmation: the breakout
The pattern is not complete until price breaks and closes above the upper trendline. A strong close matters more than an intraday wick. In markets where centralized volume is fragmented, look for momentum expansion (range, speed, follow-through) as confirmation. Many traders prefer a throwback—a brief retest of the broken trendline—before committing size.
Trading the falling wedge
Entry:
- Conservative: buy the close above the upper trendline.
- Aggressive: buy the throwback retest after the breakout.
Stop-loss:
Common placement is below the most recent swing low inside the wedge, or just under the lower trendline with a small buffer.
Targets:
Measure the widest part of the wedge and project that distance upward from the breakout point.
Intermediate targets often align with prior resistance or round numbers.
Risk management is essential. Because wedges can produce false breaks near the apex, keep risk small and let confirmation do the heavy lifting.
Common mistakes to avoid
Traders often enter before the breakout, confusing compression with confirmation. Another pitfall is ignoring trend context—counter-trend wedges need stronger confirmation. Finally, placing stops too tight invites normal volatility to knock you out before the move unfolds.
FAQs
Q: Is the falling wedge bullish or bearish?
A: Bullish; it signals weakening selling pressure.
Q: When is it confirmed?
A: On a clear close above the upper trendline.
Q: Where should the stop go?
A: Below the latest swing low or lower trendline.
Q: How do I set targets?
A: Project the wedge’s widest height from the breakout.


