Hanging man pattern: A complete trading guide
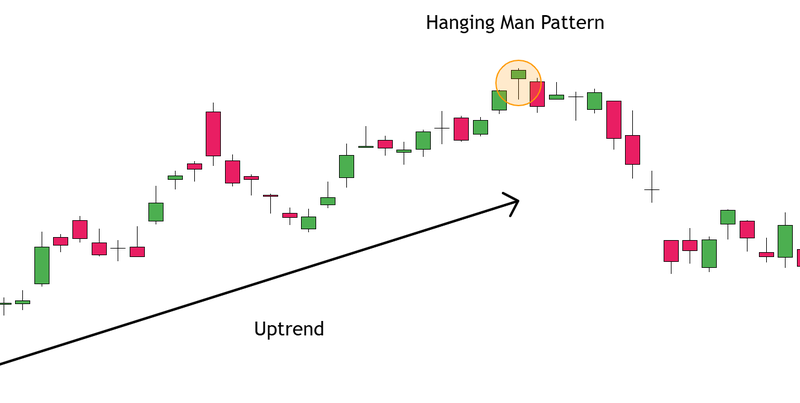
The hanging man pattern is a single-candlestick formation in technical analysis that signals a potential bearish reversal. It appears at the top of an uptrend and indicates that the market may be losing upward momentum.

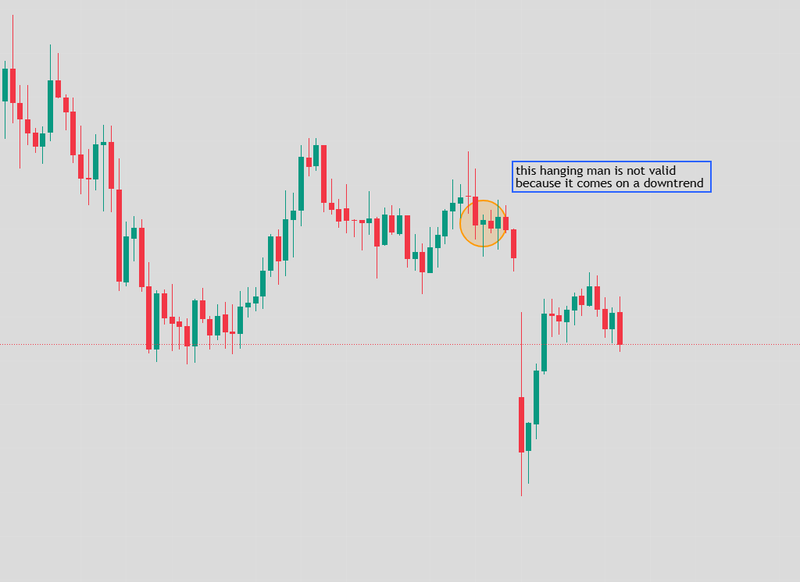
The hanging man to be considered valid, it must form after a clear upward move.
Acting on the pattern without confirmation exposes traders to unnecessary risk.
The most logical place for a stop-loss is just above the high of the hanging man candle.
What is the hanging man pattern
The hanging man pattern is a single-candlestick formation in technical analysis that signals a potential bearish reversal. It appears at the top of an uptrend and indicates that the market may be losing upward momentum. While it may look simple at first glance, its significance lies entirely in its location and the story it tells about shifting control between buyers and sellers.
For the hanging man to be considered valid, it must form after a clear upward move. Without an existing uptrend, the pattern loses its meaning. It is not just the shape of the candle that matters, but the context in which it appears. At market highs, this candle becomes a warning that buying pressure is weakening and that sellers are beginning to test control.
Source: wrtrading
How to identify the hanging man pattern
The hanging man has a very specific structure. It consists of a small real body positioned near the top of the candle’s range, combined with a long lower shadow that is typically at least twice the size of the body. The upper shadow is either very small or completely absent.
This structure reflects a session where price initially drops significantly, creating a long lower wick, before recovering and closing near the opening level. Variations do exist, and the body can be either bullish or bearish in color, but the key requirement remains the same: a long lower shadow and a small body near the top.
The shape alone, however, is not enough. A candle with this structure can appear in many places on a chart, but it only becomes a hanging man when it forms after an uptrend and near a potential resistance area.
Source: Trading View
Market psychology behind the hanging man
During the session, sellers managed to push price significantly lower, creating the long lower shadow. This is the first important signal, as it shows that selling pressure is entering the market.
However, buyers step in and push price back up, closing near the top of the range. On the surface, this may seem like strength, but the deeper interpretation is more cautious. The fact that sellers were able to drive price down so sharply suggests that the uptrend is no longer as stable as before.
The market is showing the first signs of vulnerability. Buyers are still present, but they are no longer in full control. The hanging man reflects a shift from dominance to uncertainty, which often precedes a reversal or at least a corrective move.
Confirmation rules
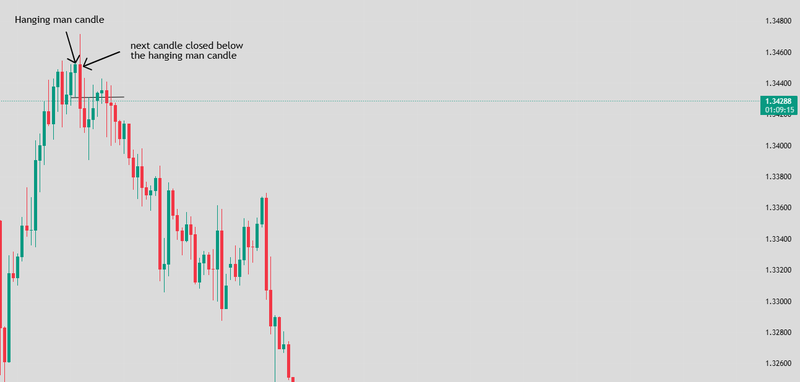
Acting on the pattern without confirmation exposes traders to unnecessary risk, as many hanging man formations fail to lead to reversals.
Confirmation typically comes from the next candle. The strongest signal occurs when the following candle closes below the body or even the low of the hanging man. This indicates that sellers have followed through and that the initial weakness observed in the pattern is turning into real downward momentum.
Without this confirmation, the pattern remains only a warning, not a trade signal. The market may simply continue higher, invalidating the bearish implication.
Source: Trading View
How to trade the hanging man pattern
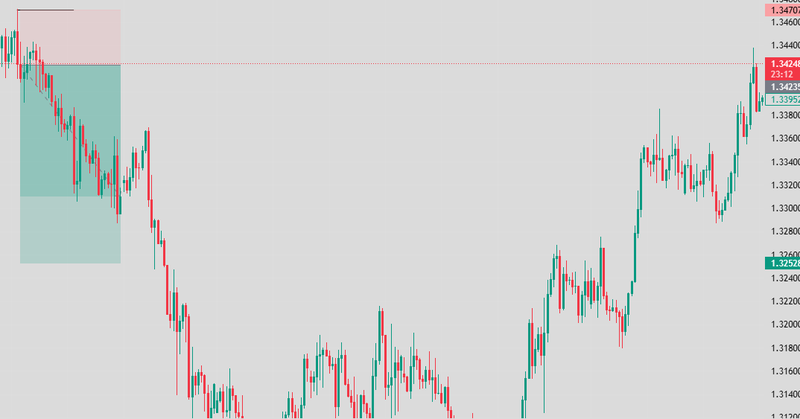
In practice, traders approach the hanging man in two main ways, depending on their level of aggressiveness and risk tolerance. A more conservative approach involves waiting for confirmation. This means entering a short position only after the next candle closes below the hanging man’s body or breaks its low. This method reduces the risk of false signals and aligns the trade with confirmed momentum.
A more aggressive approach involves entering as soon as price breaks below the low of the hanging man candle. This allows for earlier entry and potentially better pricing, but it also carries a higher risk of failure, especially in strong trends where pullbacks are shallow.
Regardless of the approach, patience is key. The hanging man is not about predicting the exact top, but about identifying when conditions begin to shift in favor of sellers.
Risk management and stop-loss placement
The most logical place for a stop-loss is just above the high of the hanging man candle. This level represents the point where the bearish idea is invalidated.
If price moves above the high, it suggests that buyers have regained control and that the pattern has failed. By placing the stop at this level, traders define their risk clearly and avoid staying in losing positions unnecessarily.
Position sizing and risk-to-reward ratios should also be considered. Even with confirmation, no pattern guarantees success, so trades must be structured with discipline.
Source: Trading View
Reliability and key filters
The effectiveness of the hanging man pattern increases significantly when it appears in the right context. Patterns that form near strong resistance levels are generally more reliable, as these areas already represent zones where selling interest is expected.
Volume can also play a role. A hanging man accompanied by higher-than-average volume suggests stronger participation and increases the credibility of the signal. Additionally, combining the pattern with other indicators, such as overbought conditions on momentum oscillators, can help filter out weaker setups.
Higher timeframes tend to produce more reliable signals. A hanging man on a daily chart carries more weight than one on a lower timeframe, where noise and random price fluctuations are more common.
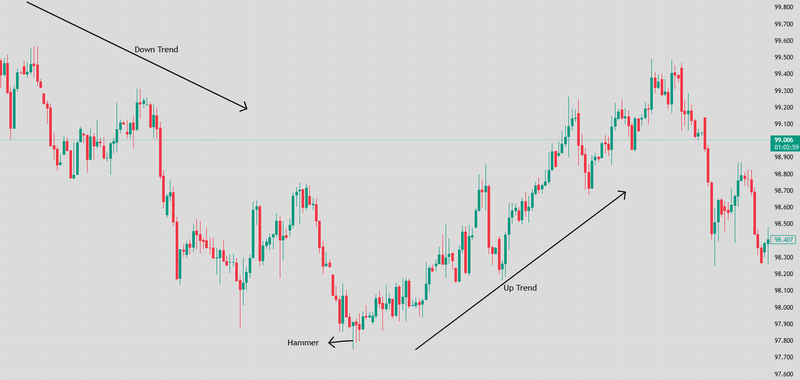
Hanging man vs hammer
The hanging man and the hammer look almost identical, but they carry completely different meanings due to their location. The hanging man appears after an uptrend and signals potential bearish reversal, while the hammer forms after a downtrend and signals potential bullish reversal.
Source: Trading View
FAQs
How reliable is the Hanging Man pattern?
The hanging man pattern can be reliable when it forms after a clear uptrend and is confirmed by a bearish follow-through candle. Its reliability increases when combined with resistance levels, volume, or other technical indicators.
What timeframe works best for the Hanging Man pattern?
Higher timeframes such as the 4-hour and daily charts tend to provide more reliable signals, as they reduce market noise and reflect stronger market sentiment.
What is an inverted Hanging Man candlestick?
There is no official pattern called an inverted hanging man. A similar-looking candle with a long upper shadow is typically referred to as a shooting star, which is also a bearish reversal pattern.
Is the Hanging Man bullish or bearish?
The hanging man is a bearish reversal pattern. It signals potential weakness in an uptrend and the possibility of a downward move if confirmed.


