Risk and return: The trading metrics that matter
Correctly evaluating a trading strategy does not only involve examining profitability; it is also necessary to measure how much risk the trader assumes to generate that profit. This article discusses essential risk and performance metrics, as well as operational efficiency indicators.
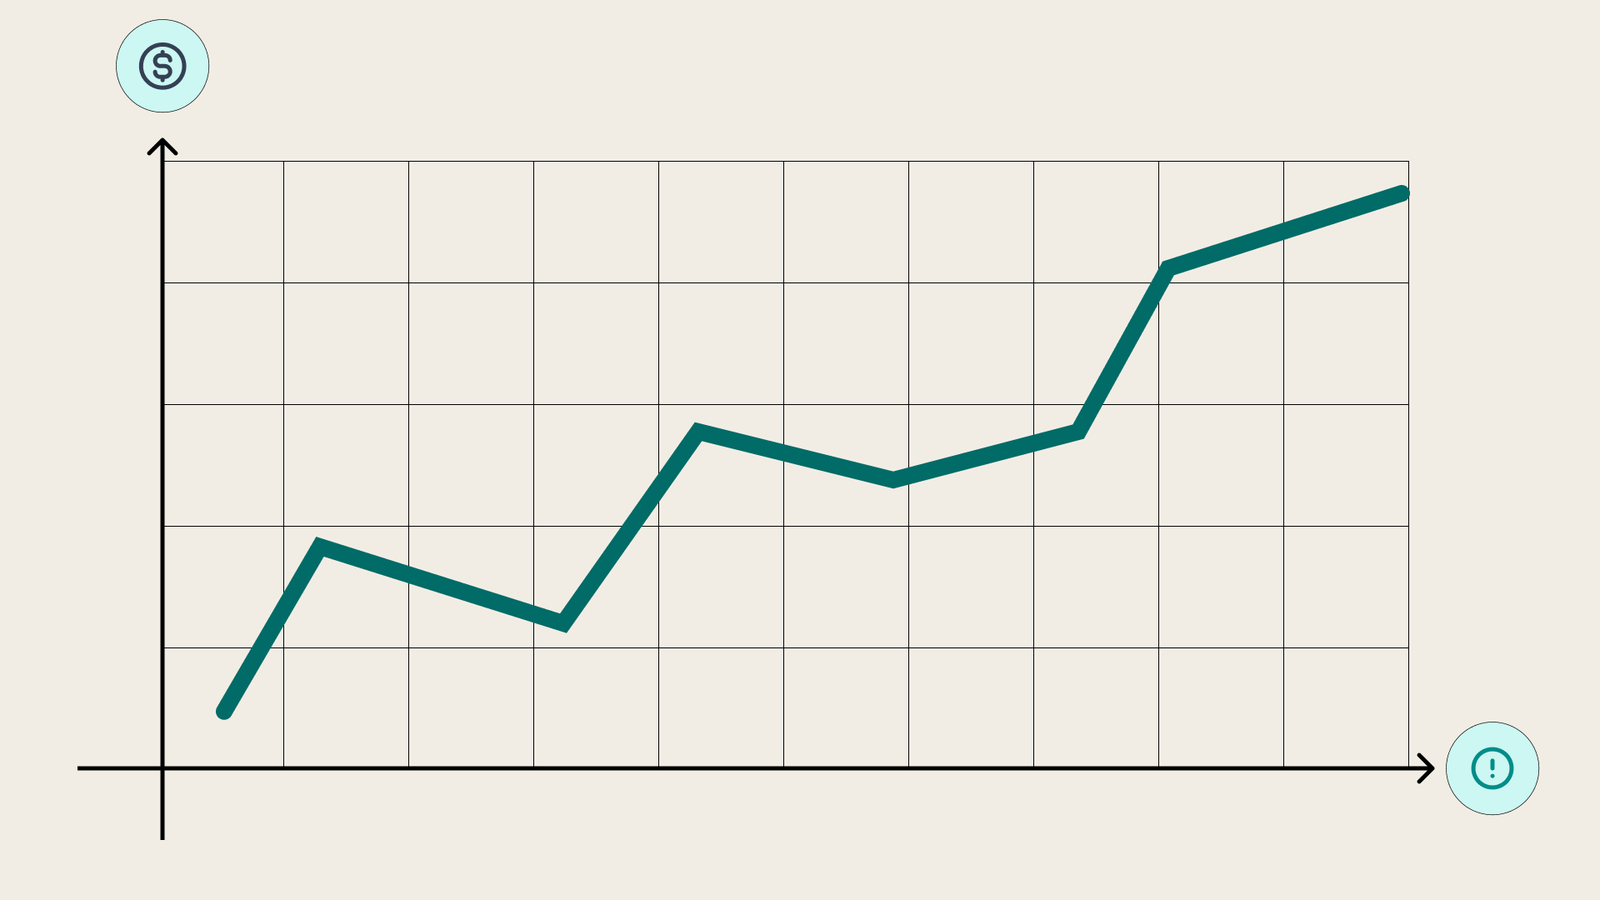
Giving a proper reading of risk and return metrics in trading increases the likelihood of achieving consistency through optimisation.
Among the main risk assessment indicators are volatility analysis, maximum drawdown (MDD) and value at risk (VaR).
Trading performance ratios that stand out are the Sharpe ratio and the profit factor.
Among the most relevant operational performance metrics are the win rate and the risk–reward ratio.
What are risk and return metrics in trading and why are they important?
Risk and return metrics related to trading practice are high-value indicators that allow the periodic evaluation of a trader’s results. On the one hand, performance metrics evaluate the trader’s ability to generate profits. On the other hand, risk metrics measure the exposure that the trader is accepting with respect to possible losses.
Accepting that in the practice of trading there will always be winning and losing positions, the key point is the trader’s ability to maximise profits and minimise losses. Regardless of whether the trader uses automated strategies or applies manual trading, the correct interpretation and management of trading metrics contribute greatly to the achievement and improvement of results.
Risk assessment metrics
Volatility (standard deviation)
Volatility is a measure of dispersion that reflects how returns vary over time. In other words, volatility indicates how much the price of an asset varies with respect to its average behaviour. If volatility is high, the asset is considered riskier, and vice versa. It is important to note that there is no single “optimal” level of volatility, as this depends on the trader’s risk profile.
Formula:
- Volatility = standard deviation of returns × √(number of periods evaluated)
Maximum drawdown (MDD)
Maximum drawdown (MDD) refers to the largest percentage loss experienced from a peak (maximum value) to a trough (minimum value). That is, it indicates the largest percentage loss that has affected the portfolio. Generally, a small and controlled MDD is desirable; a higher MDD can indicate performance with greater risk exposure. One way to optimise MDD is to reduce it as far as reasonably possible; however, that depends on the trader’s chosen risk profile.
Formula:
- MDD = [(Minimum Value − Maximum Value) / Maximum Value] × 100
Value at Risk (VaR) and Conditional Value at Risk (CVaR)
VaR estimates the maximum potential loss that an investment could suffer, over a given period, with a pre-established confidence level. VaR can be calculated by the historical method, via a parametric approach (assuming a normal distribution), or through Monte Carlo analysis (stochastic simulation).
CVaR is a measure of financial risk that complements VaR because it calculates the average expected loss in the most volatile scenarios. In other words, CVaR calculates the average loss when the VaR threshold has already been exceeded, reflecting the expected worst-case tail outcome.
Profitability evaluation metrics
Sharpe ratio
The Sharpe ratio compares the profitability of an investment portfolio with its implied risk. In other words, the indicator measures the excess return that a portfolio has achieved and compares it with the volatility to which the portfolio has been exposed.
Formula:
- Sharpe Ratio = (Return on Portfolio − Risk-Free Rate) / Volatility of Portfolio
Sharpe ratio optimisation can be pursued in two ways:
- improving the profitability of the portfolio or trading account;
- decreasing the portfolio or trading-account volatility.
Profit factor
The profit factor measures the ratio of gross profit to gross loss of a trading account. A value of 1 implies no profit, since gains and losses are equal; a value greater than 1 indicates potential profitability; a value less than 1 indicates that the account is not profitable. The indicator may be improved by raising the win rate or increasing the average profit per trade. It may also improve if the average size of permitted losses is reduced.
Formula:
- Profit Factor = Total Profit / Total Loss
Trading system metrics
Win rate
The win rate indicates the number of winning trades in relation to the total positions taken. The ratio is measured as a percentage and, all else equal, the aim is for it to be as high as possible. The higher the win rate, the higher the probability that the trading account will generate profits over time. To optimise the indicator, one can refine the strategy’s decision rules or test complementary strategies with the aim of increasing its value. However, it is important to recognise that maintaining a very high win rate (≥ 70%) is difficult and often unlikely; even small, sustainable improvements can compound meaningfully over time.
Formula:
- Win Rate = (Total Trades with Profit / Total Trades Made) × 100
Risk–Reward ratio
The risk–reward ratio measures the relationship between a possible gain and a possible loss. This is one of the most relevant indicators for optimisation when combined with the win rate. For example, an account with a 50%-win rate can be profitable if the average profit per trade exceeds the average loss. Joint optimisation is therefore important. However, achieving this balance is not easy, as differences in volatility and leverage (especially when trading derivatives) across assets complicate parameterisation. A pragmatic approach is to maximise the risk–reward ratio in a manner consistent with the market traded, the instruments used, and the implemented strategy.
Formula:
- Risk–Reward Ratio = Expected Profit / Risk of Loss
Common limitations and biases
- There is no single “best” metric; robust assessment arises when indicators are analysed in a complementary way.
- Many additional indicators and ratios can enrich performance analysis; continued study is therefore valuable.
- Measurement windows and underlying assumptions matter. To avoid misinterpretation, each indicator should be evaluated in the context of its theoretical framework and the data-generation process.
- Over-optimisation bias. Although indicators facilitate the optimisation process, outcomes depend on the trader’s profile. Trade timeframe, objectives, and risk tolerance are closely related to feasible optimisation paths.
Conclusion
Whether the strategy is manual or automated, risk, return and performance metrics are central to achieving better results. It is not enough to observe a strategy’s performance potential; it is also necessary to evaluate the risk to which the trader is exposed when implementing a methodology, so parameters can be adapted appropriately. At the same time, it is important to evaluate the trader’s performance metrics continuously in order to address weaknesses and reinforce strengths. Optimisation is viable, provided objectives are realistic for the trader’s profile and aligned with their experience.
