Support and resistance techniques in trading
Support and resistance levels are among the most widely used tools in technical analysis owing to their simplicity and practical utility. They reflect aggregated demand and supply, highlighting price zones at which reversals or continuations are more likely.

Support identifies demand zones where a decline is likely to halt and reverse higher; resistance identifies supply zones where advance is likely to stall and reverse lower.
Support and resistance are best treated as zones rather than precise lines; false breakouts are common and volume validation is important.
Typical methods to locate these zones include highs/lows, trend lines, psychological levels, moving averages, Fibonacci retracements and pivot points.
Common strategies using these concepts are range trading, breakout trading and pullback trading; each has specific confirmation tools and distinct risk considerations.
Robust position sizing and stop placement (for example using ATR or Bollinger Bands) are essential to manage the risk of invalid signals.
Concepts of support and resistance
Support and resistance form the foundation of many technical-analytical approaches. Their appeal lies in the way they reduce price information into actionable zones: areas where buyers or sellers have historically shown decisive interest.
Support
In technical terms, a support zone is an area where a downward move often loses momentum and from which a rebound is likely. It represents a ‘market floor’ where demand tends to exceed supply, triggering upward price reactions.
Resistance
Conversely, a resistance zone is an area where an upward move typically stalls and from which a reversal to the downside is possible. It represents a ‘market ceiling’ where supply typically overwhelms demand.
Support and resistance are not rigid horizontal lines but rather spatial zones that reflect the range in which orders cluster. During periods of consolidation prices may oscillate between these zones; when one of them is breached with conviction, the resulting ‘breakout’ or ‘breakdown’ can initiate a new trend. Because false breakouts occur frequently, traders commonly seek additional confirmation — for example, heightened trading volume — before committing capital.
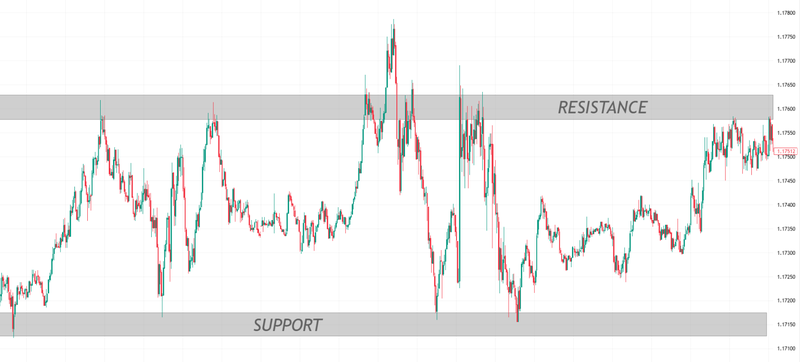
Figure 1. Support and resistance level (example).
Institutional perspective: supply and demand zones
From an institutional or order-flow viewpoint, large market participants accumulate positions at perceived discount levels (support) and distribute positions at perceived premium levels (resistance). These phases are often described as accumulation (buying into support) and distribution (selling into resistance).
Risk management is critical in this context. Poorly positioned stop losses can be targeted during intra-session volatility, producing so-called false breaks. Institutional actors may deliberately exploit tight retail stops; hence, astute placement of stop-loss and take-profit orders — informed by volatility measures such as the Average True Range (ATR) or Bollinger Bands — is a necessary element of trade design.
Identifying support and resistance zones
Traders identify support and resistance using both pure price action and indicator-based methods. Key approaches include:
Price-action and market-structure methods
- Highs and lows: Recent swing highs and lows commonly form reference support and resistance zones.
- Trend lines: Diagonal support or resistance that links successive higher lows (in an uptrend) or lower highs (in a downtrend).
- Psychological levels: Round numbers (for example, $3,000 or $4,000) are frequently significant because they are memorable and attract clustered orders.
Indicator-based methods
- Moving averages: Long-term moving averages (50, 100, 200 periods) often act as dynamic support or resistance.
- Fibonacci retracements: Retracement ratios (38.2%, 50% and 61.8%) commonly highlight probable pullback zones within established trends.
- Pivot points: Intraday pivot calculations provide likely intraday support and resistance levels used widely by short-term traders.
Trading strategies using support and resistance
Support and resistance underpin a set of straightforward yet effective trading strategies. Below are three commonly used approaches, with typical confirmation tools and primary risks.
Range trading strategy
- Logic. Applicable when price moves laterally between clear support and resistance zones.
- Execution. Buy near support and sell near resistance; conversely, short near resistance and cover near support. Targets are set at the opposite boundary.
- Confirmation. Oscillators (RSI, Stochastic) help identify overbought/oversold conditions that coincide with the zone.
- Risk. Range strategies fail when consolidation terminates in a breakout. Is relevant to use stop-loss orders and avoid trading ranges in highly trending markets.
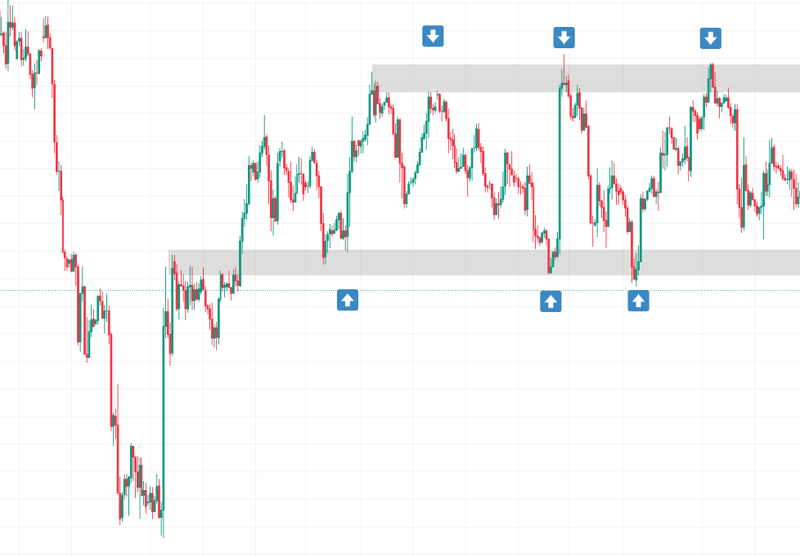
Figure 2. Range Strategy (example).
Breakout trading strategy
- Logic. Designed to capture momentum when price breaches a well-defined zone, signalling the start of a new trend.
- Execution. Enter long on a decisive upside break of resistance (or short on a decisive downside break of support).
- Confirmation. Volume is the principal confirmation: a breakout accompanied by above-average volume suggests institutional participation and improves the probability of a sustained move.
- Risk. False breakouts are common; traders often use retest techniques or staggered entries and tight stop-losses to mitigate risk.
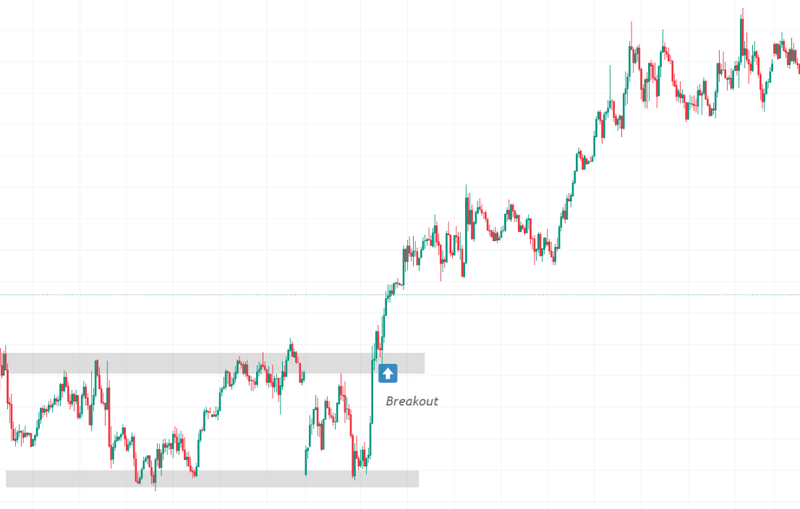
Figure 3. Breakout Strategy (example).
Pullback (polarity) strategy
- Logic. Based on the principle of polarity: a breached resistance frequently becomes subsequent support and vice versa.
- Execution. After a breakout, wait for a retest of the broken zone; enter when the retested zone holds as support (for longs) or as resistance (for shorts).
- Confirmation. Candlestick patterns (hammer, bullish/bearish engulfing) at the retest increase the probability of a valid continuation.
- Risk. The retest can fail, particularly in volatile markets; protective stops and defined position sizing are vital.
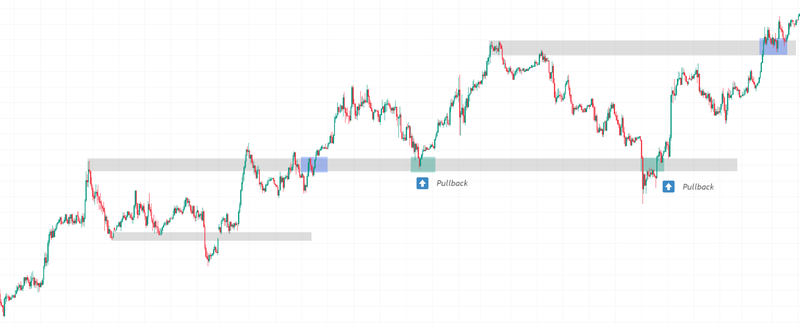
Figure 4. Pullback Strategy (example).
Risk management and execution considerations
Support and resistance strategies are only as effective as their risk management. Practical measures include:
- Position sizing based on account risk tolerance and the distance to the stop-loss.
- Stop placement beyond volatility thresholds (for example, ATR multiples) to avoid being stopped unnecessarily.
- Use of confirmation tools (volume, oscillators, candlestick structure) to filter low-probability setups.
- Awareness of context — macroeconomic announcements, earnings releases and market opening/closing behaviours can invalidate technical zones.
Conclusion
Support and resistance are fundamental constructs in technical analysis that condense market behaviour into actionable zones. When combined with confirmation indicators and rigorous risk management, they form the basis of robust trading strategies — whether operating within ranges, trading breakouts, or executing pullbacks after polarity shifts. Traders should regard these tools as probabilistic guides rather than deterministic rules; discipline, context awareness and adaptive position sizing are essential to translate them into consistent performance.
Frequently Asked Questions (FAQs)
What is the fundamental difference between support and resistance?
Support refers to a price zone where a downtrend is likely to pause or rebound. It acts as a "market floor" because demand is expected to overcome supply in this area. Conversely, resistance is a "market ceiling" or a zone where an uptrend tends to stall or reverse, as supply is expected to overwhelm demand.
Are support and resistance exact price lines?
No, they are not rigid lines. Instead, they are best understood as "spatial zones" or areas where clusters of buy or sell orders have historically been concentrated. Prices may move slightly through these levels without invalidating the zone.
What is the 'principle of polarity'?
The principle of polarity is a concept used in pullback trading strategies. It describes the common market behaviour where, once a key level is decisively broken, its role reverses. For example, a resistance level that has been breached will often become a new support level. Similarly, a broken support level frequently turns into a future resistance level.


