Trading with Fibonacci Retracements
Fibonacci levels .. The art of predicting market movements before they happen
What are Fibonacci levels?
The difference between Fibonacci retracements and extensions
Key tips for trading with Fibonacci tools
What are Fibonacci retracement levels?
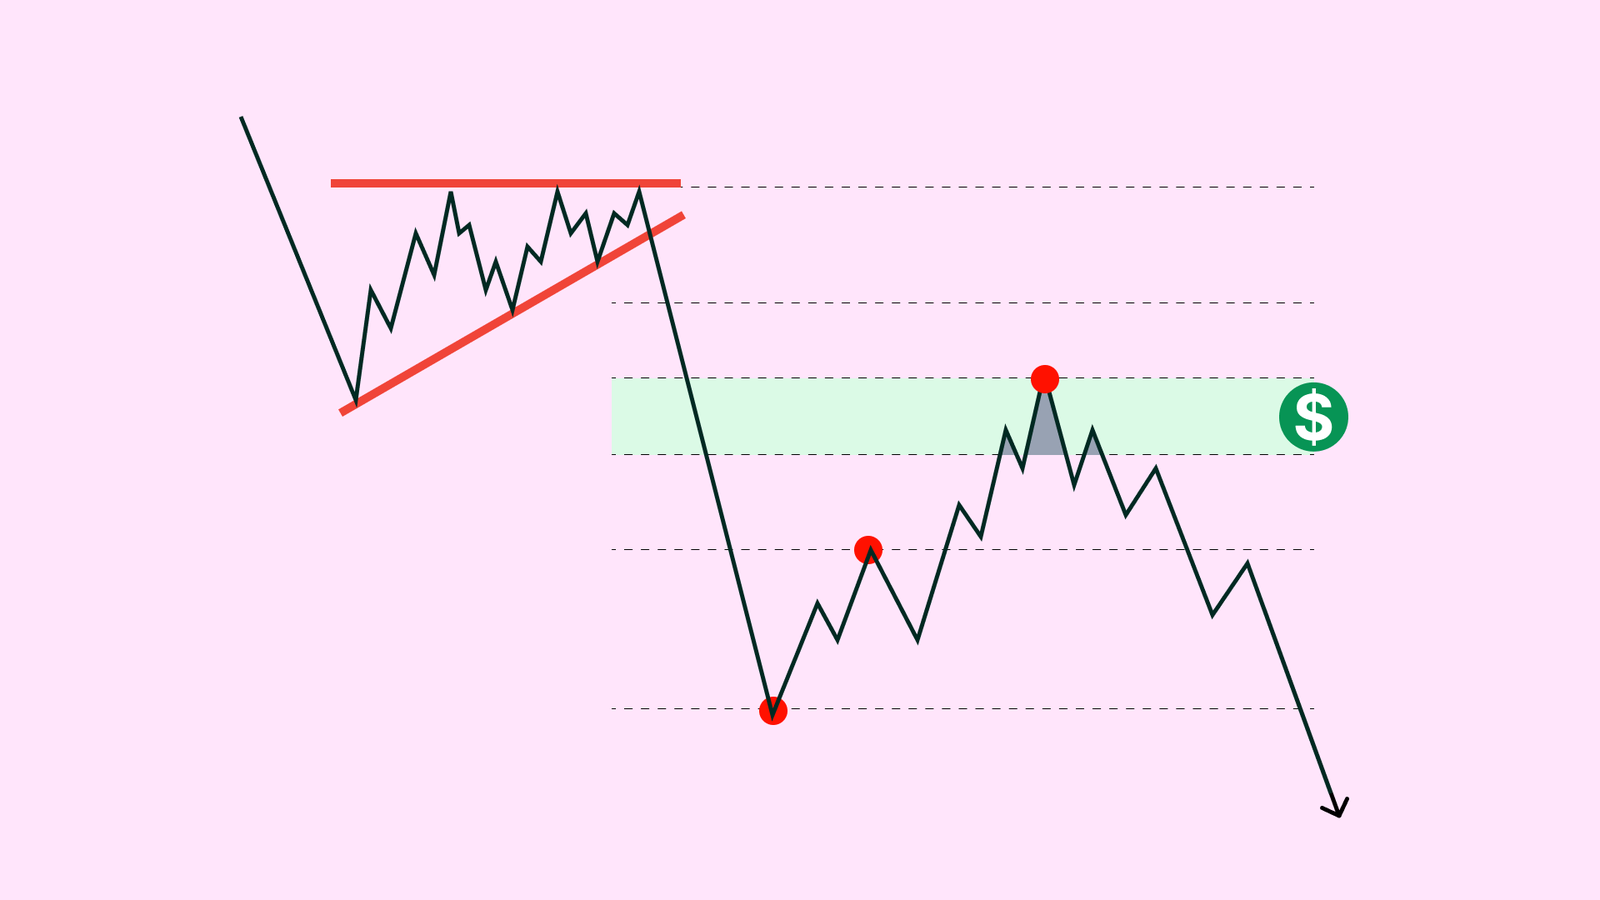
Fibonacci retracement levels include key ratios like 23.6%, 38.2%, 50%, 61.8%, and 78.6%. They are predominantly used as supplementary tools rather than sole indicators for trading decisions. The ratios most respected by prices, indicating higher probabilities of corrective phases ending and a return to the prevailing trend, are typically 38.2%, 50%, and 61.8%.
Origin and application
Fibonacci retracement levels trace their roots back to ancient mathematics, first appearing in Indian and Arabic traditions before being introduced to Western Europe by Leonardo Pisano (Fibonacci) in the 13th century. His book "Liber Abaci" popularized this sequence, replacing Roman numerals with the more efficient Hindu-Arabic numeral system. Beyond mathematics, Fibonacci's work has influenced fields like science, architecture, and finance, notably through its association with the golden ratio, observed in everything from plant growth to technical analysis.
How Fibonacci retracement works
Begin by identifying the general trend—whether upward or downward—then pinpoint the highest peak and lowest trough within that trend to draw Fibonacci levels. The primary levels 38.2%, 50%, 61.8%, 78.6%—represent potential points where the current corrective movement may end before resuming its previous direction. A bounce from the 38.2% level suggests a minor correction relative to the prevailing trend, indicating its strength, while a bounce from the 78.6% level could indicate a deeper correction underway.
Fibonacci extensions
In addition to predicting the end of corrective movements, Fibonacci levels can also be used to forecast extensions in technical analysis. Common extensions, mirroring the retracement ratios, include 161%, 150%, and 138%. These levels assist traders in identifying potential areas where a current breakout may end and the price may reverse before continuing its original trend.
Key tips for using Fibonacci retracements
While Fibonacci retracement levels are crucial in technical analysis for pinpointing potential reversal zones, they should not be solely relied upon. It's essential to integrate Fibonacci levels with other technical tools such as chart patterns, moving averages, or momentum indicators like Stochastic. Additionally, staying informed about news and geopolitical events that could significantly impact the market is crucial for comprehensive analysis.
