What is a hammer candlestick?
The hammer candlestick is one of the most widely watched bullish reversal signals in technical analysis. It appears after a decline and suggests that sellers pushed hard, but buyers stepped in strongly enough to reclaim much of the loss before the candle closed.

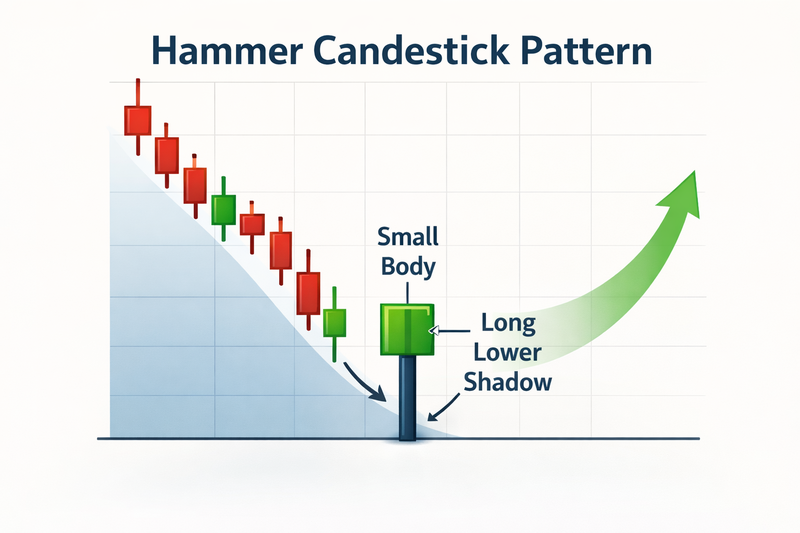
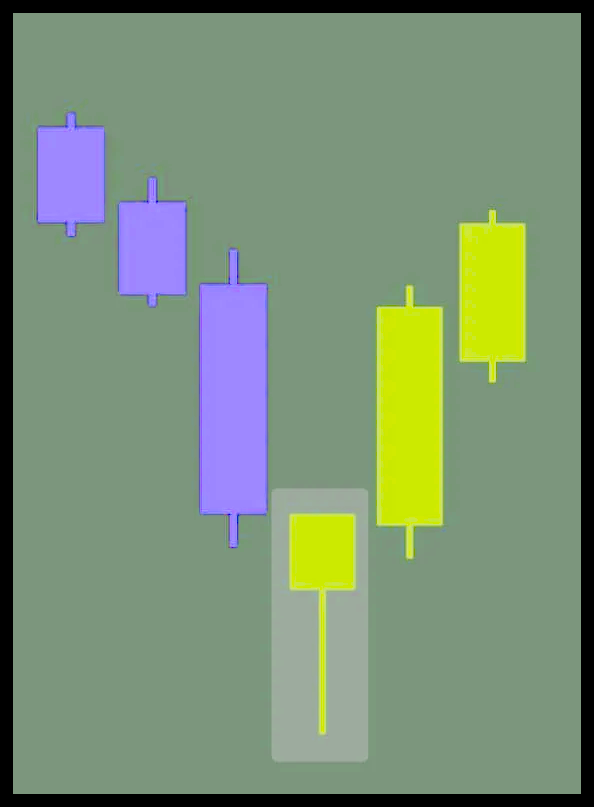
A hammer candlestick usually appears after a downtrend.
It has a small body near the top and a long lower shadow.
The pattern reflects rejection of lower prices.
Confirmation matters more than the candle alone.
Why the hammer candlestick matters
Among all candlestick patterns, the hammer stands out because it tells a very clear story in a single bar. Price drops sharply during the session, sellers appear to be in control, and then buyers force a recovery that pulls the close back toward the session high. That reversal in intraday control is what makes the hammer so important. It does not guarantee a rally, of course, but it often acts as an early warning that bearish momentum is fading.
In practical trading terms, the hammer matters because it gives traders a defined area to watch. It offers a possible turning point, a logical invalidation level, and a simple framework for managing risk. That is why it remains popular across forex, stocks, commodities, and index trading.
What a hammer candlestick looks like
A proper hammer has three main features. First, it has a small real body near the top of the candle’s range. Second, it has a long lower shadow, usually at least twice the size of the body. Third, it has little or no upper shadow.
The color of the candle can be green or red. A green hammer is often seen as a bit stronger because it shows the session closed above the open, but the color is not the main issue. The real message comes from the shape. What matters most is that the market traded much lower during the session and then rebounded sharply.
There is one more condition that traders often forget: a hammer is only meaningful if it appears after a clear decline. If the same candle shape appears in an uptrend, it is not treated as a hammer in the bullish sense. Context is everything in candlestick analysis.
The psychology behind the pattern
The hammer reflects a shift in short-term control. Sellers start the session by driving the market lower, often extending the existing decline. At that point, the chart looks weak and bearish. Then buyers step in. They absorb supply, push price back up, and force the market to close near the top of the session.
That recovery suggests that lower prices were rejected. In other words, the market tested a lower zone and did not accept it. This is why the hammer is often described as a sign that selling pressure may be exhausted.
Still, traders should be careful not to romanticize the pattern. One hammer is not proof that the trend has reversed. It is only evidence that buyers fought back during one candle. The next session needs to show follow-through.
How to identify a valid hammer
A lot of candles look like hammers at first glance, but many are poor-quality versions. A valid hammer usually forms near an established support area, after a visible downtrend, and with a lower wick that clearly stands out. If the body is too large, the pattern loses its meaning. If the upper wick is too large, the message becomes mixed. If the market is simply moving sideways, the candle is less reliable.
Good hammer setups often appear near technical levels that already matter. This might include a previous swing low, a horizontal support zone, a Fibonacci retracement, or a major moving average. When the hammer forms at one of those levels, it carries more weight because the price reaction is happening where traders already expect demand to appear.
Volume can also strengthen the pattern. If the hammer prints with above-average volume, it may indicate stronger institutional participation in the reversal. In markets where volume data is less central, traders often rely on price structure and follow-through instead.
How traders use the hammer in practice
Most experienced traders do not buy the moment a hammer appears. They wait for confirmation. The simplest confirmation is a bullish candle after the hammer, especially one that closes above the hammer’s high. That follow-through tells you buyers did not just defend the session once — they continued to push after it.
A common trading approach is to enter after price breaks above the hammer high. The stop-loss is often placed below the hammer’s low, since a break below that level suggests the reversal idea is failing. Profit targets vary, but many traders use nearby resistance, a prior swing high, or a risk-to-reward framework such as 1:2.
For example, if the distance between entry and stop is 30 pips, the trader may aim for at least 60 pips of upside. Others scale out partially as price rises and trail the rest.
When the hammer works best — and when it fails
The hammer tends to work best when it appears after an extended decline, near a strong support area, and with confirmation from the next candle. It becomes more convincing when it aligns with broader structure, such as bullish divergence on momentum indicators or a major rejection from a long-term support level.
It tends to fail when traders treat it in isolation. A hammer inside a weak range, or one that forms in the middle of choppy price action, often leads nowhere. It also loses value if the next session quickly trades below the low of the hammer. In that case, the market has effectively rejected the supposed reversal.
This is why disciplined traders treat the hammer as a signal to investigate, not as an automatic buy order.
Hammer vs similar patterns
The hammer is often confused with the hanging man, the inverted hammer, and the shooting star. The key difference is context.
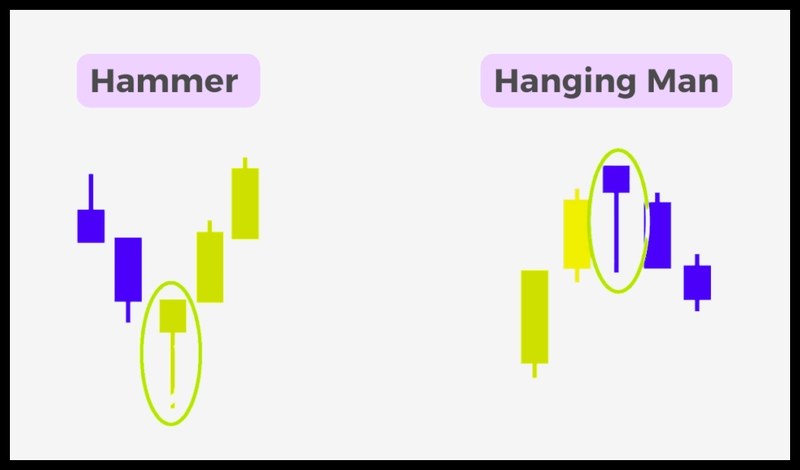
The hanging man has the same shape as a hammer, but it appears after an uptrend and is considered bearish. The inverted hammer also appears after a downtrend, but instead of a long lower shadow, it has a long upper shadow. The shooting star has the same shape as an inverted hammer, but it appears after an uptrend and carries bearish implications.
This is why memorizing candle shapes alone is not enough. Traders need to understand where the candle appears and what the surrounding market structure is saying.
The hammer candlestick remains popular because it is simple, visual, and surprisingly informative. It captures a moment when the market tried to continue lower and failed. That failure can become the first clue of a reversal, especially after a prolonged selloff.
But like most useful tools in trading, the hammer works best when it is not used alone. Combine it with support and resistance, market context, and confirmation from the next candle. Do that consistently, and the hammer becomes more than just a textbook shape — it becomes a practical decision-making tool.
FAQs
Is a hammer candlestick bullish or bearish?
It is usually bullish when it appears after a downtrend.
Does the hammer need to be green?
No. Green may be stronger, but shape and context matter more.
How do traders confirm a hammer?
They usually wait for the next candle to close above the hammer high.
Where is the stop-loss usually placed?
Most traders place it just below the hammer’s low.


