What is a triple bottom pattern in technical analysis and how does it work?
A triple bottom occurs when price holds support three times, revealing fading selling pressure and the early stages of an uptrend.

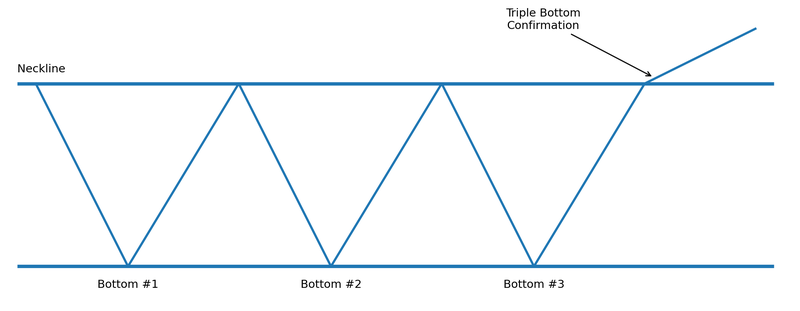
Triple bottom formation: A bullish chart pattern created when price tests the same support level three times and then breaks above resistance.
Market psychology: Reflects seller exhaustion and rising buyer strength, often preceding a shift from downtrend to uptrend.
Trading the pattern: Look for a confirmed breakout above neckline resistance, set stops below recent lows and target a move equal to the pattern height.
Comparison: Unlike double bottoms or inverse head and shoulders patterns, triple bottoms add confirmation at the cost of slower development.
What is a triple bottom chart pattern
A triple bottom is a classic forex reversal pattern that signals a bearish trend is likely ending and a bullish reversal is underway. It consists of three successive lows (troughs) at roughly the same price level, with intervening rallies that hit a similar high (forming a horizontal resistance line). In simpler terms, the market tries to push lower three times, finds a floor each time, and eventually buyers gain enough strength to drive the price upward through a key resistance. This pattern is considered a bullish reversal formation because it flips a downtrend into a new uptrend once confirmed. Triple bottoms are less common than double bottoms, but when they do appear, they often precede significant price reversals given the strong base built by multiple support tests.
A typical triple bottom formation: price makes three similar lows (marked 1, 2, 3) at a strong support zone, with a horizontal “neckline” drawn across the interim swing highs. The bullish reversal is confirmed when the price breaks above this neckline after the third bottom. This diagram highlights how the market repeatedly fails to break below the same support level, signaling that sellers are exhausted and a solid base has formed.
When and how a triple bottom forms?
A triple bottom pattern usually forms after an extended downtrend, when selling pressure has driven prices lower over a significant period. The formation process unfolds in stages:
- First bottom: The price plunges to a new low, finds support, and bounces as some buyers step in. This initial rebound is often accompanied by a surge in trading volume from value-seekers or short-covering.
- Second bottom: After a modest rally, the price falls back to retest that same support level. It holds again, roughly around the prior low. At this point, volume on the sell-off often diminishes, hinting that fewer sellers are willing to push beyond that support.
- Third bottom: The price declines yet again to the familiar support area for a third test. Sellers still cannot break below it. This third successful defense is critical – it reinforces the notion that the support level is rock-solid. By now, bearish momentum has significantly waned, and each bounce off support has boosted buyers’ confidence.
All the while, the highs between these lows form a clear resistance level (neckline) across the chart. The triple bottom typically spans several weeks or even months, as it takes time for the market to retest support three times and for sentiment to shift. This makes triple bottoms one of the slower chart patterns to fully mature, especially in forex markets that trade 24/7. Patience is key – until the pattern completes, it might resemble other formations like a double bottom (after two lows) or even a range/rectangle pattern.
Trader psychology and market context
The triple bottom pattern encapsulates a dramatic shift in market psychology. During the preceding downtrend, bears (sellers) were in control. However, with each bottom in the pattern, sellers’ inability to drive prices to new lows signals exhaustion. By the third bottom, pessimism among sellers has given way to optimism among buyers – the market “votes” three times that a certain price floor is fundamentally or psychologically significant. Each rebound from the support increases traders’ confidence that the downtrend is losing steam.
From a sentiment standpoint, a triple bottom suggests that fear of further decline is fading, and value-oriented buyers are accumulating positions at the established support. The support zone becomes a battleground that buyers repeatedly defend, creating a psychological barrier against falling prices. When the pattern finally breaks out upward, it often coincides with a surge of bullish sentiment (and volume) as more traders recognize the trend reversal. Essentially, the triple bottom marks a transition from a supply-dominated market to one where demand decisively takes over. This context is often reinforced if other factors (like oversold technical indicators or improving fundamentals) align with the bullish reversal.
Identifying and confirming a triple bottom
Spotting a triple bottom in real time requires diligence, because early on it can be confused with a mere double bottom or another consolidation. Key identification criteria include three distinct lows around the same price level (within a few percentage points of each other) and a clear resistance line across the intervening highs. The pattern is most reliable when it appears after a well-defined downtrend and each trough is well-separated in time (often with at least several days or weeks between troughs, allowing the pattern to “breathe”). Symmetry is a hallmark of a quality triple bottom: the three lows should be reasonably aligned horizontally and the rallies in between should reach comparable heights. If one low is dramatically lower than the others, the formation might instead be an inverse head and shoulders rather than a true triple bottom.
Confirmation is critical before acting on a suspected triple bottom. The bullish signal is only considered confirmed when price breaks out above the neckline (resistance) that caps the interim highs. Traders typically wait for a daily candle to close above that resistance level, ideally on increased volume, to ensure the breakout is legitimate and not a false move. Volume often provides a telltale clue: during the formation, volume tends to contract on each successive bottom, reflecting dwindling selling pressure, and then spikes on the breakout as buyers rush in. Using additional technical evidence can bolster confidence – for example, a bullish divergence on an oscillator like RSI or MACD around the third low, or the price breaking a downtrend trendline, can reinforce the case that a true reversal is in play. Remember that until the neckline is decisively breached, the triple bottom pattern remains incomplete and unconfirmed (essentially neutral).
How to trade the triple bottom pattern (entry, stop, target)
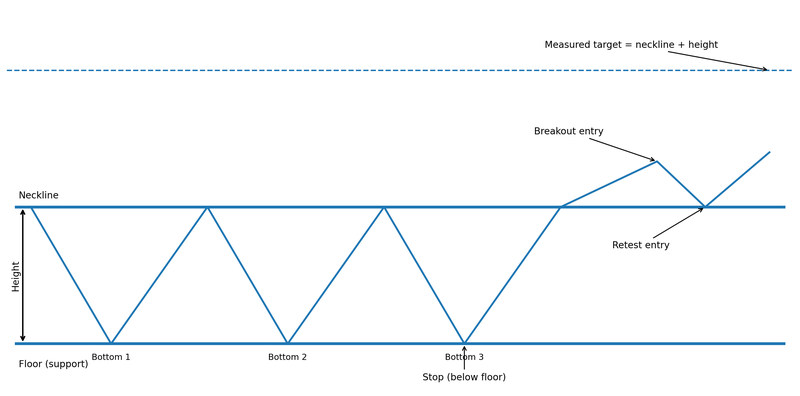
Trading a triple bottom pattern in forex requires discipline: one should resist the urge to jump in too early and instead let the market prove the pattern. The standard approach is to go long (buy) once price breaks above the neckline resistance after the third bottom, confirming the bullish reversal. Often, traders will set a buy order just above the resistance level or enter on a close above it, ensuring they only trade once the pattern has validated itself. A strong surge in volume on the breakout day adds conviction to the trade, as it signals broad participation in the upward move.
When it comes to managing risk on this setup, a well-placed stop-loss is vital. A common practice is to put the stop-loss just below the support level of the triple bottom – essentially under the lowest of the three troughs. The logic is straightforward: if the price falls back and pierces that proven support after breakout, it likely means the pattern failed and the downtrend may resume. Some aggressive traders may tighten the stop to just below the third bottom, which could reduce risk but carries a higher chance of being prematurely stopped out by normal volatility. In any case, positioning the stop slightly below the support (with a small buffer) helps avoid getting nicked by minor false breakouts while still protecting you if the market truly reverses course against the trade.
For take-profit targets, many traders use the measured move technique. Calculate the vertical distance from the triple bottom lows up to the neckline (this is the pattern’s “height”). Then project that distance upward from the breakout point to estimate a target price. For example, if the support was at 1.2000 and the neckline at 1.2500, the height is 0.0500, so the initial target after breakout would be roughly 1.3000. This target is an approximate guideline – real-world results may vary, and traders often adjust for market conditions (e.g. setting a slightly more conservative goal if volatility is high). It’s also wise to consider partial profit-taking or trailing stops as the price approaches the objective, in case momentum continues beyond the projection. Always evaluate the reward-to-risk ratio; many experts recommend aiming for at least a 2:1 reward-to-risk to justify the trade, meaning the potential gain is at least twice the size of the risk (stop distance).
FAQs
Q: How does a triple bottom differ from a double bottom?
A: Three similar lows vs. two; stronger confirmation but slower to form.
Q: Is a triple bottom bullish or bearish?
A: Bullish reversal after a downtrend; the bearish counterpart is a triple top.
Q: How do I confirm a triple bottom?
A: A clean close above the neckline, ideally with rising volume.
Q: Where should the stop-loss go?
A: A few pips below the lowest low, with a small buffer.


