Support
 Moving averages explained: A guide for traders
Moving averages are widely used in technical analysis to help traders understand trends, momentum and potential changes in market direction. Learn how moving averages work, when traders use them and how SMA and EMA compare.
Learn what moving averages are and how they help identify market trends.
Understand the difference between Simple Moving Averages (SMA) and Exponential Moving Averages (EMA).
Discover how traders use moving averages for trend analysis, support and resistance, and trade management.
Explore common moving average settings, including the 20-day, 50-day and 200-day averages.
Understand the limitations of moving averages and why they're often combined with other technical indicators.
Why are moving averages so popular?
Moving averages are among the most widely used technical indicators in financial markets. Traders use them across forex, stocks, indices and commodities to make price trends easier to identify and reduce the impact of short-term price fluctuations.
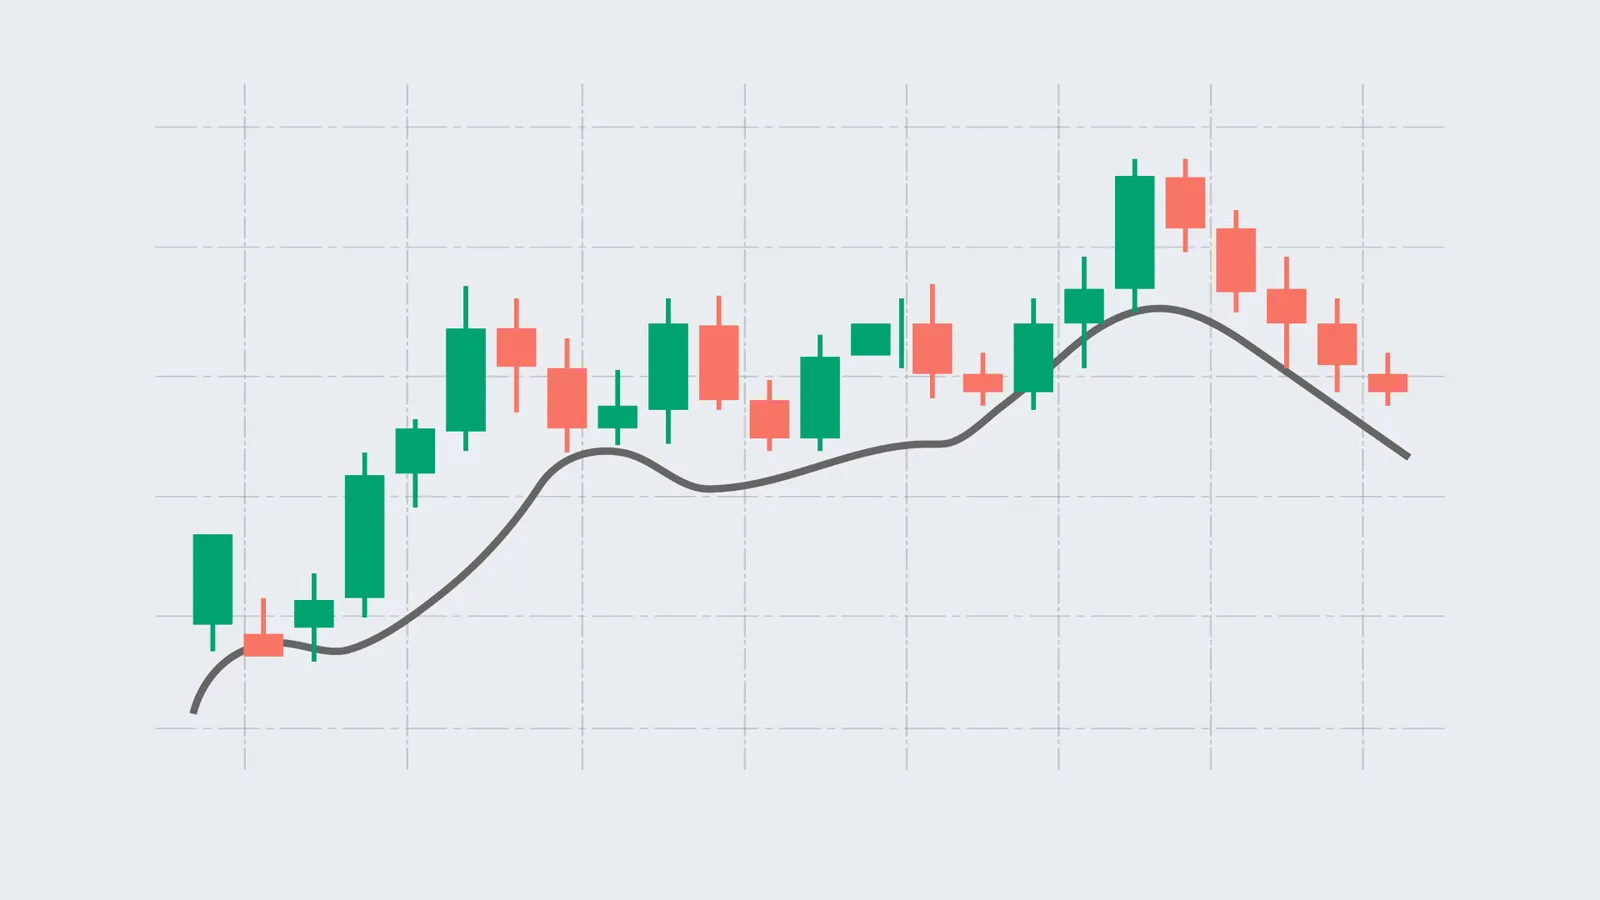
Rather than reacting to every price movement, a moving average calculates the average price of an asset over a set period and plots it as a line on a chart. Because the average updates as new price data becomes available, the line updates as new price data becomes available, producing a smoother line than the price itself. This can make it easier to see whether prices are generally trending higher, lower or moving sideways.
How traders use moving averages
Traders use moving averages in several ways. They can help identify the direction of a trend, highlight potential areas of support and resistance or signal possible changes in trend or momentum when two moving averages cross.
Moving averages can also be adjusted to suit different trading styles and timeframes. Shorter periods respond more quickly to recent price movements, while longer periods provide a smoother view of the broader trend. They are widely available on charting platforms and can be applied across different financial markets.
Understanding the limitations of moving averages
Moving averages are lagging indicators because they are calculated using historical price data. They do not predict where prices will move next, and signals may only appear after a market movement has already started.
They can also produce misleading signals when prices are moving sideways or changing direction frequently. For this reason, traders often use moving averages alongside other technical indicators, price action or broader market analysis rather than relying on them alone.
How traders use the 50-day and 200-day moving averages
The 50-day and 200-day moving averages track the average price of an asset over the previous 50 or 200 trading days. Both can help traders assess the direction of a trend, but they provide different perspectives because of the periods they cover.
The 50-day moving average is commonly used to follow medium-term price trends. Because it covers a shorter period, it responds more quickly to recent price movements and can help traders see how the current trend is developing.
The 200-day moving average provides a longer-term view and reacts more slowly to price changes. Traders and investors often use it to assess the broader market trend and may also watch how prices behave around the moving average as a potential area of support or resistance.
The relationship between the two averages can also provide useful information. A golden cross occurs when the 50-day moving average crosses above the 200-day moving average. Traders generally interpret this as a bullish signal because it suggests that the medium-term trend is strengthening relative to the longer-term trend.
The opposite is known as a death cross. This occurs when the 50-day moving average crosses below the 200-day moving average and is generally interpreted as a bearish signal, suggesting that the medium-term trend is weakening relative to the longer-term trend.
However, these crossovers do not predict what will happen next. Because moving averages are based on historical prices, golden and death crosses can occur after a significant price movement has already taken place and may sometimes produce false signals.
Identifying trend direction with moving averages
Financial markets are constantly changing, with prices often moving sharply over short periods. This volatility can make it difficult to determine whether an asset is experiencing a genuine trend or simply reacting to temporary market noise.
Moving averages help address this by smoothing price data over a chosen period, allowing traders to focus on the underlying direction of the market.
In general, when the price trades above a moving average, it suggests the market is in an uptrend. When the price trades below a moving average, it may indicate a downtrend. Traders often use this relationship as a simple way to confirm the prevailing market direction before looking for potential trading opportunities.
Moving average crossovers can provide additional confirmation. A bullish crossover occurs when a shorter-term moving average crosses above a longer-term moving average, suggesting upward momentum may be strengthening. A bearish crossover occurs when the shorter-term average crosses below the longer-term average, indicating that downward momentum could be increasing.
These signals are most effective when they develop within an established trend rather than during sideways market conditions.
How to use moving averages in a trading strategy
Moving averages are often used as one part of a broader trading strategy rather than as standalone buy or sell signals. Many traders first use a longer-term moving average to identify the overall trend before looking for opportunities to trade in the same direction.
Identifying trade opportunities
If an asset continues trading above its 50-day moving average, some traders may consider the market to be in an established uptrend. Instead of entering immediately, they may wait for the price to pull back towards the moving average before looking for confirmation from candlestick patterns, support and resistance levels or another technical indicator.
Managing open trades
Some traders also use moving averages to help manage risk after entering a trade. Rather than acting as fixed stop-loss levels, moving averages can provide a dynamic reference point for monitoring whether a trend remains intact. If price consistently holds above the moving average, traders may remain in the position, whereas a sustained break below it could suggest that market conditions are changing.
Confirming trading signals
During an uptrend, if the price pulls back to the 50-day moving average before rebounding, some traders may view that area as a potential continuation zone. However, confirmation from price action, trading volume or another technical indicator is often used before making a trading decision.
Moving averages work best when combined with other forms of technical analysis rather than being used in isolation.
Common moving average settings and what they show
There is no single moving average period that works for every market or trading strategy. Shorter periods respond more quickly to recent price movements, while longer periods create a smoother line that can make broader trends easier to identify.
10-day moving average
The 10-day moving average follows recent price movements relatively closely, making it useful for analysing short-term trends and momentum. Its greater sensitivity means it can respond quickly when prices change direction, but it may also produce more false signals during volatile or sideways markets.
20-day moving average
The 20-day moving average provides a slightly smoother view of short-term price movements. Traders may use it to follow developing trends, monitor momentum or identify potential pullbacks within an existing trend.
50-day moving average
The 50-day moving average is widely used to assess medium-term trends. It responds more slowly than shorter-period averages, helping to smooth out short-term price fluctuations while still reflecting changes in the broader direction of the market. Traders may also watch how prices behave around the 50-day average as a potential area of support or resistance.
100-day and 200-day moving averages
The 100-day and 200-day moving averages provide a longer-term view of price trends and respond more slowly to recent market movements. The 200-day moving average in particular is widely followed as an indicator of broader market direction, with traders often monitoring how prices behave above, below or around it.
The choice of moving average period depends on factors such as the market, chart timeframe and trading strategy. Traders may compare different periods or use more than one moving average to see both shorter- and longer-term trends rather than relying on a single setting.
SMA vs EMA: What’s the difference?
There are several types of moving averages, but two of the most widely used are the simple moving average (SMA) and exponential moving average (EMA). Both track average prices over a chosen period, but they differ in how much weight they give to recent price data.
How does an SMA work?
A simple moving average calculates the average price over a specified period, giving equal weight to each price in the calculation. As new price data becomes available, the oldest data point is removed and the average is recalculated.
Because an SMA gives equal importance to prices throughout the period, it tends to respond more gradually to recent price changes than an EMA using the same period. This can make it useful for following broader trends without placing additional emphasis on the latest price movements.
How does an EMA work?
An exponential moving average gives greater weight to more recent prices while still taking earlier prices into account. This makes it more responsive to recent market movements than an SMA using the same period.
The additional responsiveness can help traders identify changes in short-term momentum sooner. However, it can also make an EMA more sensitive to temporary price movements, particularly when markets are volatile or moving sideways.
When might traders use an SMA or EMA?
Neither type of moving average is inherently better than the other. The choice depends on factors such as the trader’s strategy, timeframe and the market being analysed.
For example, a trader looking at broader price trends might use a 50-day SMA, while someone who wants the moving average to respond more quickly to recent price movements might choose a 20-day EMA.
Some traders also use SMAs and EMAs alongside other forms of technical analysis or compare different moving average periods to get a broader view of market conditions.
Moving averages as support and resistance
Moving averages are often used as dynamic support and resistance levels. Unlike horizontal support or resistance, which remain fixed at a specific price level, moving averages continually adjust as new market data becomes available.
How moving averages act as support and resistance
During an uptrend, prices may repeatedly pull back towards a moving average and then resume the trend, leading some traders to treat the area as potential support. In these situations, some traders view the moving average as a potential support area where buying interest could return.
Conversely, during a downtrend, prices may struggle to move above a moving average before continuing lower. This can cause the moving average to act as a dynamic resistance level.
Because widely followed averages such as the 50-day and 200-day moving averages are monitored by many market participants, price reactions around these levels can sometimes become more pronounced.
However, moving averages should not be viewed as exact price levels. Instead, many traders treat them as zones of potential support or resistance and wait for additional confirmation before entering or exiting a trade.
Confirming support and resistance signals
A trader may look for a bullish candlestick pattern, increased trading volume or confirmation from another technical indicator before acting on a price bounce from a moving average.
The chart below shows the Dow Jones (US30 Roll) with a blue 20-day exponential moving average alongside a 50-day exponential moving average. As the market trend develops, the relationship between these two averages changes. When the shorter-term EMA crosses above the longer-term EMA, it may indicate strengthening bullish momentum. When it crosses below, it may suggest that momentum is weakening and the market trend could be changing.
The limitations of moving averages
Moving averages can help traders identify trends and interpret price movements, but they also have limitations. Their usefulness can vary depending on market conditions, the period selected and how they are incorporated into a wider trading strategy.
Moving averages are lagging indicators
Moving averages are calculated using historical price data, which means they respond to price movements rather than anticipate them. Signals such as moving average crossovers may therefore appear after a trend has already started or after a significant price movement has taken place.
The amount of lag can also vary. Longer-period moving averages generally respond more slowly to recent price changes, while shorter-period averages react more quickly but can be more sensitive to short-term fluctuations.
Moving averages can give false signals
Moving averages tend to provide clearer signals when prices are trending consistently. In sideways or range-bound markets, prices may repeatedly cross above and below a moving average without developing a sustained trend. This can create whipsaws, where signals are quickly reversed as prices change direction.
Volatile market conditions can also make moving average signals more difficult to interpret, particularly when prices move sharply over short periods.
For these reasons, traders often use moving averages alongside other forms of analysis, such as price action, support and resistance levels or other technical indicators. No moving average can reliably predict future price movements, so signals should be considered within the wider market context.
Combining moving averages with other technical indicators
Moving averages are often most effective when used alongside other forms of technical analysis. Rather than relying on a single indicator, many traders combine several tools to build a more complete picture of market conditions and improve the quality of potential trading signals. Here’s an example:
The Relative Strength Index (RSI) can help identify whether an asset appears overbought or oversold, while the Moving Average Convergence Divergence (MACD) is commonly used to assess momentum and potential trend changes. Some traders also use Bollinger Bands to analyse market volatility and identify periods when prices may be stretching away from their average.
Price action, chart patterns, trading volume and support and resistance levels can also provide valuable confirmation. For example, if the price rebounds from a widely watched moving average while RSI strengthens and buying volume increases, traders may have greater confidence that the prevailing trend remains intact.
Using multiple forms of analysis does not guarantee successful trades, but it can help traders filter out weaker signals and make more informed trading decisions.
FAQs
How do I choose the right moving average?
The right moving average depends on your trading style and timeframe. Shorter moving averages, such as the 10-day or 20-day, react more quickly to price changes and are often used by short-term traders. The 50-day moving average is widely used to identify medium-term trends, while the 100-day and 200-day moving averages help assess the broader market direction. There is no single setting that works for every market, so many traders test different periods to find those that best suit the asset and timeframe they're trading.
What are the biggest mistakes traders make with moving averages?
One of the most common mistakes is treating moving averages as predictive indicators. Because they are based on historical prices, they confirm trends rather than forecast future price movements. Traders should also avoid relying on moving averages during sideways or range-bound markets, where false signals are more common. Using a moving average or crossover in isolation without confirming the signal through price action or other indicators can also lead to poor trading decisions.
How can moving averages help with risk management?
Some traders use moving averages as a guide for managing trades rather than as fixed entry or exit points. For example, during an uptrend, a moving average may act as a reference for monitoring whether the trend remains intact. If the price consistently holds above the moving average, some traders may stay in the trade, while a sustained move below it could suggest changing market conditions. Moving averages should always be used alongside a broader risk management strategy rather than as the sole basis for stop-loss or take-profit decisions.
Should I use an SMA or an EMA?
A Simple Moving Average (SMA) gives equal weight to every price over the selected period, making it useful for identifying broader market trends. An Exponential Moving Average (EMA) places greater emphasis on recent prices, allowing it to respond more quickly to market movements. Many short-term traders prefer EMAs because they provide faster signals, while longer-term traders often favour SMAs because they produce smoother trend analysis with fewer short-term fluctuations.
How reliable are golden crosses and death crosses?
Golden crosses and death crosses are widely used to confirm changes in longer-term market momentum, but they are not always reliable. Because these signals are based on historical prices, they often occur after a trend has already begun. They can also produce false signals during sideways markets. For this reason, many traders look for additional confirmation from price action, trading volume or other technical indicators before acting on a crossover.
Do moving averages work in sideways markets?
Moving averages generally perform best when markets are trending. During sideways or range-bound conditions, prices can repeatedly move above and below the moving average without establishing a clear direction, creating false signals known as whipsaws. To reduce the likelihood of these signals, many traders wait for stronger trend confirmation or combine moving averages with other technical analysis tools before making trading decisions.