ADX indicator in trading: How it works and why it matters
The Average Directional Index (ADX) is a technical indicator that helps traders understand how strong a trend is, no matter the direction of the market.

The purpose of the ADX is to identify whether an asset is trending or consolidating within a range.
An ADX reading above 25 signals a strong, tradable trend - either bullish or bearish - while values below 20 suggest a weak or absent trend.
The ADX is made up of three parts: the ADX line, the positive directional indicator (+DI), and the negative directional indicator (–DI).
Traders often use the ADX with other technical indicators to confirm signals and spot better trading opportunities.
What is the ADX?
The Average Directional Index (ADX) is a technical indicator that ranges between 0 and 100, which aims to measure the strength of a price trend. The indicator was created by J. Welles Wilder and published in his book "New Concepts in Technical Trading Systems" to help traders identify the presence and strength of market momentum.
It is important to mention that the ADX is a non-directional indicator, meaning a high value can indicate either a strong uptrend or a strong downtrend. Its main utility lies in differentiating between trending moves and periods of consolidation, allowing traders to apply trend-following strategies more effectively.
Although the ADX is considered a lagging indicator, its combination with other tools such as moving averages, the RSI oscillator, or the MACD, makes it a critical component of robust technical analysis strategies. In turn, the ADX is an effective indicator for managing both trade entries and exits. Initially, a trader may use it to find trending moves with the potential for continuation. Subsequently, identifying a weakening trend helps in taking profits or adjusting stop-loss levels to secure gains.
Core ADX elements
The ADX directional movement system can be understood through its three core components:
- The ADX line: Measures the overall strength of the trend.
- The Positive Directional Indicator (+DI): Measures the strength of the upward price movement. When +DI is above –DI, buyers are dominant.
- The Negative Directional Indicator (–DI): Measures the strength of the downward price movement. When –DI is above +DI, sellers are dominant.
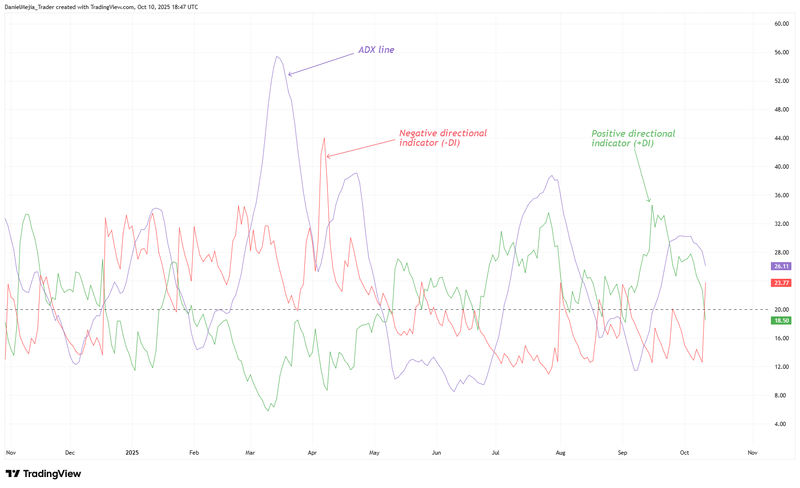
Figure 1. Average Directional Index (ADX). Source: Figure obtained from TradingView
ADX calculation
The ADX calculation methodology can be broken down into the following steps:
1. Calculation of Directional Movements (+/-DM):
+DM =[Highto] − [Hight−1]
−DM =[Lowt−1] − [Lowto]
2. Calculation of Directional Indicators (+/–DI):
+DI =( [Exponential Moving Average of (+DM)]n / [Average True Range]n ) ⋅ 100
−DI =( [Exponential Moving Average of (−DM)]n / [Average True Range]n ) ⋅ 100
3. Calculation of the Directional Movement Index (DX):
DX =( [∣(+DIn) − (−DIn )∣] / [∣(+DIn) + (−DIn )∣] ) ⋅ 100
4. Calculation of the Average Directional Index (ADX):
ADX =( [(ADXt−1)⋅(n−1)] + DXto ) / n
Where:
- t-1 = previous value
- to = current value
- n = number of periods used in the calculation
Reading ADX levels
The interpretation of the ADX line is crucial as it focuses on measuring trend strength. The ADX is plotted on a scale from 0 to 100, with values generally divided into thresholds that define the market's momentum:
- ADX below 20: Indicates a weak or trendless market. The price is moving sideways, and trend-following strategies are likely to be ineffective.
- ADX between 20 and 25: This is a neutral zone. A trend may be starting to form, but it lacks confirmation. While aggressive traders might see a reading above 20 as an early signal, a value above 25 is the standard confirmation.
- ADX above 25: This level signals a strong and healthy trend. It is considered the ideal zone for trend traders to look for opportunities. A rising ADX slope reinforces the signal's strength.
- ADX above 50: Indicates a very strong trend, which may be approaching exhaustion. If the ADX line reaches an elevated level and then begins to decline, it can signal that the trend is losing momentum.
Using the ADX in trading
The ADX can be a valuable complement to various trading strategies. Some common uses include:
- Trend Confirmation: The primary strategy is to use the ADX as a filter that distinguishes between trending and sideways markets. Trend-following trades should ideally be taken only when the ADX is above 25.
- Confirming Breakouts: When the price breaks a key support or resistance level, a rising ADX crossing the 25 threshold can confirm the validity of the breakout, increasing the probability that the move will continue.
- DI Crossovers: A buy signal can be generated when the +DI line crosses above the –DI line (provided the ADX is above 25). Conversely, a sell signal occurs when the –DI crosses above the +DI under the same ADX strength condition. However, it is important to note that DI crossovers were not the indicator's primary intended use.
Key points when using the ADX
- The ADX is a lagging indicator, so significant price moves can occur before the ADX signals a strong trend.
- The ADX line is non-directional. Therefore, it is essential to complement its reading with the relationship between the +DI and –DI lines to ensure a correct interpretation.
- The ADX is best used in combination with other indicators, especially as a filter to identify strong trends.
- The ADX reading is timeframe-dependent. It can be applied to long-term periods (daily, weekly) and short-term periods (hourly, minutes). It is important to note that longer-term trends are generally more robust than short-term ones.
- The indicator's parameters can be adjusted. Most trading software defaults to a 14-period setting for 'n'. Increasing 'n' will smooth the indicator and reduce noise but will also generate fewer signals. Decreasing 'n' may increase the number of signals, but they may be less reliable.
FAQ
What is the ADX and what is it mainly used for?
The Average Directional Index (ADX) is a technical indicator that measures the strength of a market trend, regardless of whether it is bullish or bearish. Its main purpose is to help traders differentiate between a market that is moving with momentum (trending) and a market that is consolidating (sideways), allowing them to apply trend-following strategies only when conditions are favourable.
How are the ADX values interpreted?
The interpretation is based on a scale of 0 to 100, where the key levels are:
- Below 20: Indicates a weak or non-existent trend (sideways market).
- Between 20 and 25: A neutral zone where a trend might be forming but is not yet confirmed.
- Above 25: Signals a strong and tradable trend, representing an ideal area to look for opportunities.
- Above 50: Indicates an extremely strong trend, which could be approaching exhaustion.
What are the components of the ADX system?
The ADX system comprises three lines that provide a comprehensive market view:
- ADX Line: Measures the overall strength of the current trend.
- Positive Directional Indicator (+DI): Measures the strength of upward price movement. When +DI is above –DI, it indicates that buyers are in control.
- Negative Directional Indicator (–DI): Measures the strength of downward price movement. When –DI is above +DI, it indicates that sellers are dominant.
Conclusion
The Average Directional Index (ADX) is a valuable technical indicator for the interpretive benefits it offers. Its calculation allows the strength of a trend to be quantified, acting as a filter to distinguish between trending markets and sideways movements. The ADX also complements other technical indicators and analysis methods, such as Price Action and chart pattern analysis. However, its multiple components can be confusing, so a comprehensive reading of all its variables is essential to benefit from its full potential.


