What is a Doji candle pattern - And why it matters
Doji candles often hint at moments of indecision, potential trend reversals, or critical turning points in the market.
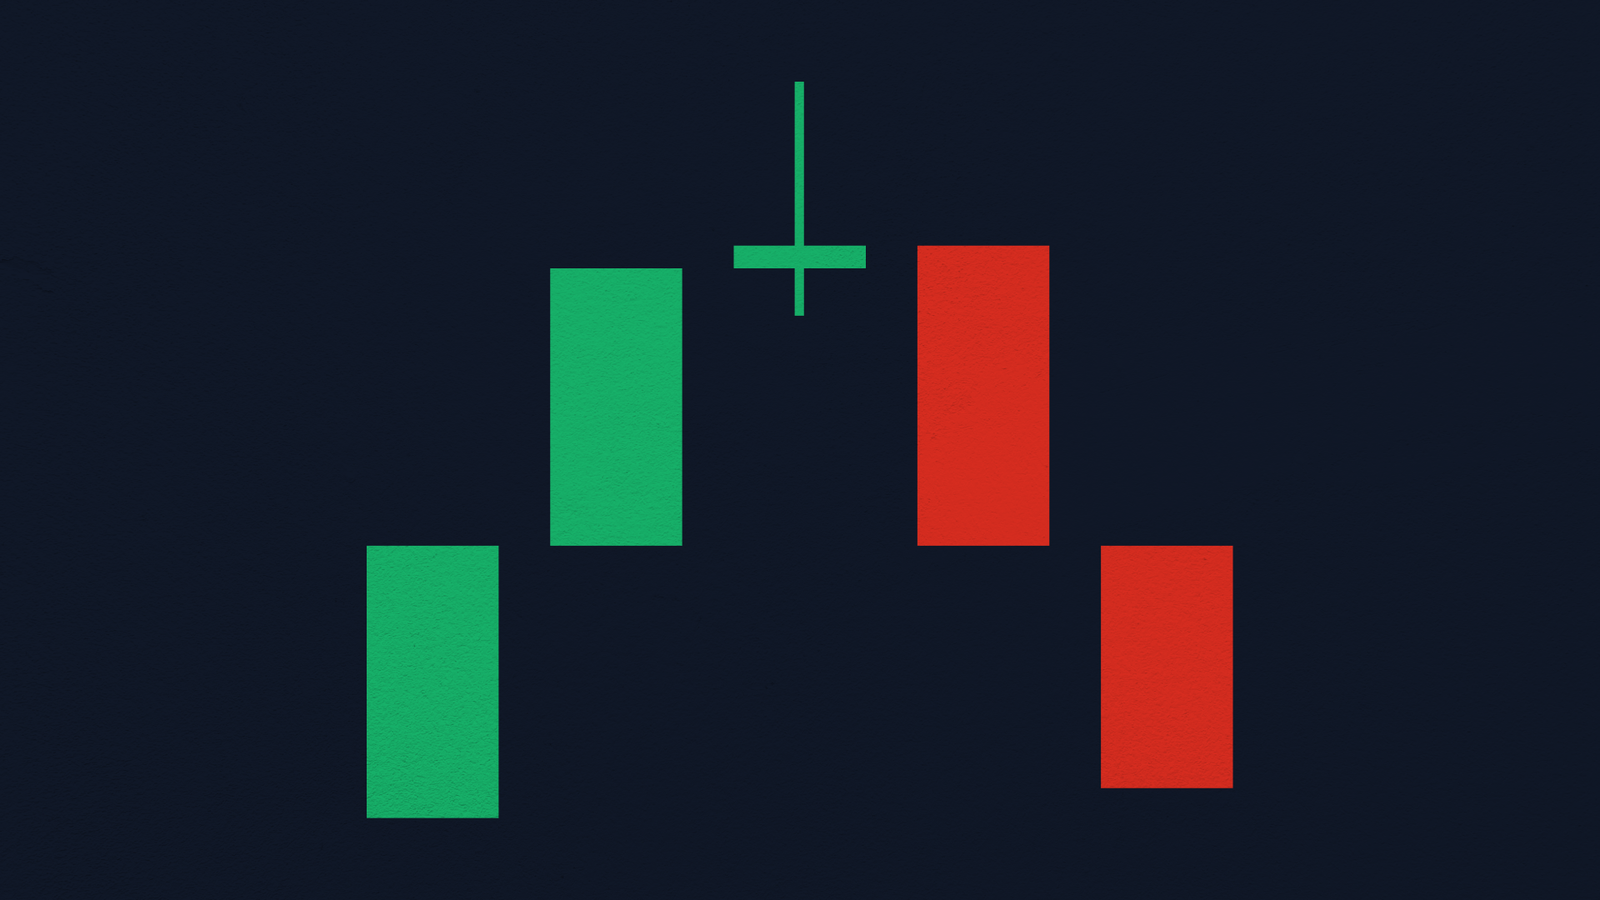
A Doji candle forms when the open and close prices are nearly equal
Doji candles are best used as alerts, not standalone signals
Context and confirmation are essential
When scanning charts for price signals, few candlestick patterns draw as much attention as the Doji. Simple in form yet powerful in implication.
But what exactly is a Doji candlestick, and how can traders interpret it effectively?
What Is a Doji Candle?
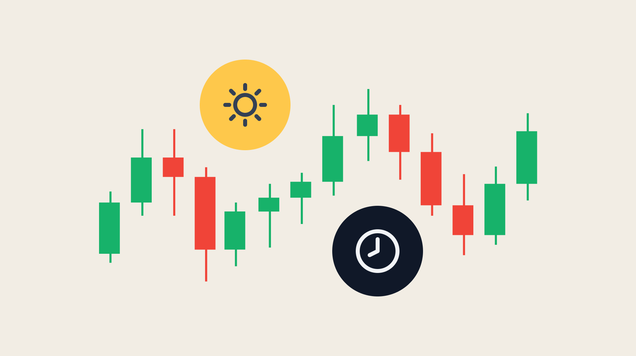
A Doji candle forms when an asset’s opening and closing prices are nearly equal, resulting in a candlestick that looks like a cross or plus sign. This shape signals that neither buyers nor sellers had control, reflecting uncertainty or balance in the market.
Unlike long-bodied candles that indicate strong momentum, a Doji represents a pause or a standoff. Depending on where it forms and what precedes it, this pattern can reveal opportunities to anticipate reversals or validate trends.
Doji Candle Meaning: More Than Just Indecision
While the general meaning of a Doji is market indecision, its placement within the trend makes all the difference.
- In uptrends, a Doji may signal a potential bullish exhaustion or reversal.
- In downtrends, it can suggest a possible bottom or shift in sentiment.
The market context, volume, and confirmation from subsequent candles are crucial for accurate interpretation.
Types of Doji Candlestick Patterns
Not all Dojis are created equal. Here are the most common types:
- Standard Doji – Open and close are virtually identical with short shadows. A classic sign of neutrality.
- Long-Legged Doji – Features long upper and lower shadows. Suggests strong indecision and increased volatility.
- Gravestone Doji – Opens and closes at the session low with a long upper shadow. Often seen at the top of uptrends and can indicate bearish reversal.
- Dragonfly Doji – Opens and closes at the session high with a long lower shadow. Typically found near market bottoms.
- Doji Star – Appears after a strong candle and can signal a potential reversal, especially when combined with other indicators.
Reversal Doji vs. Continuation
A reversal Doji candlestick isn’t always about calling tops and bottoms: it’s about spotting tension. In some cases, a Doji may act as a pause before continuation, especially during strong trends.
Always look for confirmation: a bullish Doji followed by a strong green candle may signal a breakout; a bearish follow-up may confirm a trend reversal.
Incorporating Doji Patterns Into Your Trading Strategy
Doji candles aren’t signals to trade blindly—they’re alerts to pay closer attention. Here’s how to use them:
- Combine Dojis with support/resistance levels for stronger conviction.
- Use in conjunction with momentum indicators like RSI or MACD.
- Always wait for the next candle before making a decision.
In trading, clarity often emerges from confusion. The Doji candlestick is a minimalist yet profound signal that speaks volumes when read in the right context. Learn to spot it, frame it within broader patterns, and let it sharpen your sense of market timing.
