DAX index retreats as economic sentiment declines amid intensifying global risks
German economic sentiment underwent a precipitous contraction in April, reaching its lowest level since late 2022. This downturn is primarily attributed to escalating geopolitical friction in the Middle East and the subsequent surge in energy costs.

The ZEW economic sentiment index crashed to -17.2, significantly missing market forecasts and reflecting the profound impact of Middle Eastern conflicts on the German economic outlook.
Critical industrial sectors are facing substantial declines, with automotive sentiment plunging by 44.2 points alongside notable contractions in the steel and chemicals industries.
Despite the fundamental headwinds, the DAX-40 maintains a long-term bullish structure, trading above major moving averages, though momentum indicators signal that the index is nearing overbought territory.
April sees sharp decline in German economic sentiment as geopolitical uncertainty intensifies
Economic sentiment in Germany has deteriorated sharply this month. According to data released by the Centre for European Economic Research (ZEW), the sentiment index fell into negative territory, reaching -17.2 points in April. This figure represents a significant decline from the previous reading of -0.5 and fell well short of the consensus forecast of -5 points. This release marks the index's lowest level since December 2022, underscoring the negative impact that the ongoing US-Israel-Iran conflict in the Middle East has exerted on the German economy.
An analysis provided by Trading Economics reveals that negative market expectations are not solely driven by rising energy prices; rather, an expected decline across several key industrial pillars is further eroding the economic outlook. The report highlights that sentiment in the automotive industry fell by 44.2 points, while the chemical and pharmaceutical sectors contracted by 11 points. Furthermore, steel and metal production decreased by 21 points, and the construction sector saw a deterioration of 3.8 points.
In response to these developments, the DAX-40 benchmark index retreated by 0.60% to close at 24,270 points. This movement reflects the growing apprehension amongst market participants regarding current geopolitical instability and the systemic deterioration of domestic economic sentiment.
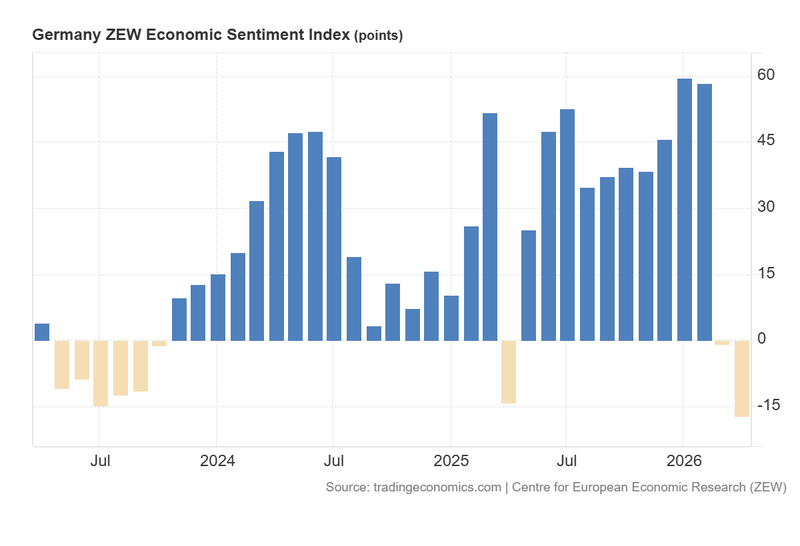
Figure 1. Germany ZEW Economic Sentiment Index (2023–2026). Source: Data from the Centre for European Economic Research (ZEW); Figure obtained from Trading Economics.
Technical analysis of the DAX index
From a technical standpoint, the DAX continues to adhere to a robust long-term bullish trajectory. The following observations detail the current market structure:
- Trend Context: The index remains entrenched in a long-term uptrend, defined by a structural sequence of "higher highs" and "higher lows". Currently, the price is trading comfortably above its 50, 100, and 200-day Simple Moving Averages (SMAs). In the short term, momentum indicators are trending upward, suggesting a sustained bullish impulse, although the index is beginning to encounter overbought conditions.
- Resistance Levels: Should the current resistance at 24,700 be decisively breached, the next significant technical target is identified at the historical peak of 25,400. A sustained move above this threshold would signal an extension of the bull market into uncharted price territory.
- Support Levels: In the event of a technical pullback, the 24,150 level serves as immediate support, representing a confluence point for the 50, 100, and 200-period SMAs. If this floor is invalidated, the next significant structural support is located at 23,280. A decisive breach of the 23,280 area would notably heighten the probability of a deeper market correction.
- Momentum Indicators: Both the Moving Average Convergence Divergence (MACD) and the Relative Strength Index (RSI) are ascending from neutral levels, suggesting that short-term momentum may yet facilitate higher valuations. However, both indicators are currently trading in proximity to overbought territory.
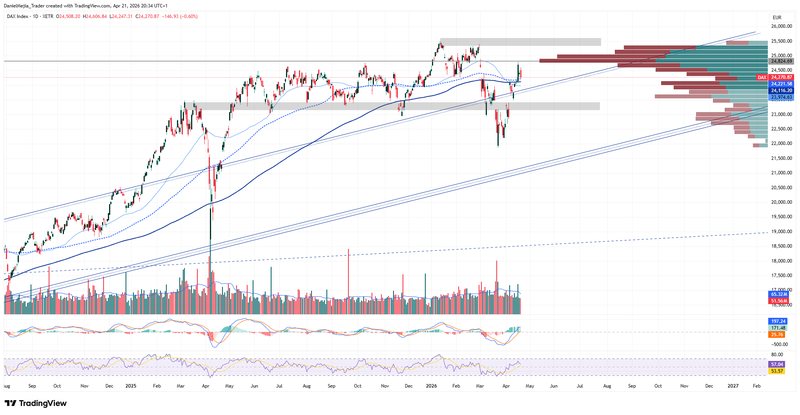
Figure 2. DAX index (2024–2026). Source: Data from the Xetra Stock Exchange; Own analysis conducted via TradingView.


