GBP/USD falls despite stronger-than-expected UK industrial production
The GBP/USD pair has encountered downward pressure despite UK industrial production exceeding consensus. While energy-related sectors demonstrated notable resilience, the pound remains in a consolidative state below key resistance levels. Although long-term bullish structures persist, the pair’s inability to rally underscores prevailing market caution regarding broader macroeconomic and geopolitical headwinds.

UK industrial production rose by 0.5% month-on-month, surpassing forecasts as the energy and mining sectors led a strategic recovery in February.
Despite the robust data, GBP/USD retreated by 0.25%, testing a critical downward trendline resistance while remaining within its established long-term bullish channel.
In contrast to the immediate price retreat, MACD and RSI readings suggest that bullish momentum is strong in the short term.
UK industrial production surpasses analyst forecasts but declines annually
According to data released by the UK Office for National Statistics, industrial production rose by 0.5% in February on a month-on-month basis. This result exceeded the 0.2% increase anticipated by analysts and marked a recovery from January’s 0.1% contraction. Conversely, the year-on-year industrial production reading revealed a contraction of 0.4%; while this was softer than the previous period’s 0.5% expansion, it was more favourable than the 0.9% contraction expected by the market consensus.
An analysis from Trading Economics highlights that the mining and quarrying industry advanced from -5.3% in January to +3.9% in February on a monthly basis. The most significant drivers within this recovery were value chains related to the extraction of crude petroleum and natural gas. Furthermore, the supply of electricity, gas, steam, and air conditioning rose from 0% to 1.5%. In contrast, manufacturing production eased from +0.2% to +0.1%; while water supply, sewerage, and waste management also decelerated from +1.5% to +0.2%. Thus, the report indicates that the United Kingdom is placing greater strategic emphasis on energy-related value chains to mitigate reliance on foreign supply.
Nevertheless, despite these positive industrial production figures, the British pound depreciated against the US dollar by 0.25% to trade at $1.3520, as the pair continues to test a pivotal resistance level.
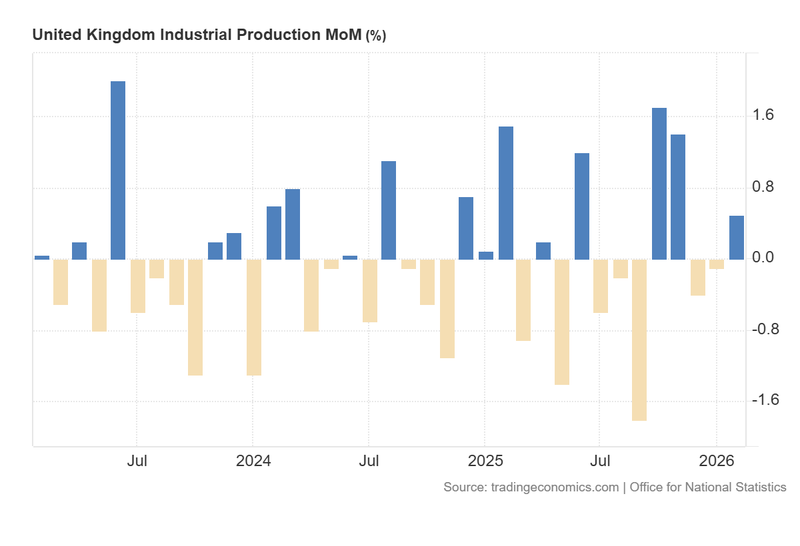
Figure 1. United Kingdom Industrial Production (2023–2026). Source: Data from the UK Office for National Statistics; Figure obtained from Trading Economics.
Technical analysis of the GBP/USD pair
From a technical perspective, the GBP/USD pair continues to trade within a well-defined long-term bullish channel. However, the immediate market structure reflects a consolidation pattern:
- Trend Context: The GBP/USD pair maintains its long-term bullish trajectory, trading above its 50, 100, and 200-period Simple Moving Averages (SMAs). In the short term, however, the pair is oscillating within a consolidative range, reflecting a temporary absence of definitive directional momentum.
- Resistance Levels: Should the pair breach immediate resistance at 1.3540—representing a downward trendline ceiling—the next significant technical level is identified at the structural resistance of 1.3670. A decisive daily close above this threshold would signal a potential extension into higher price territory and a formal resumption of the primary bullish trend.
- Support Levels: If the short-term support at 1.3420 is breached (the level where the 50, 100, and 200-period SMAs converge), the next critical floor is situated at 1.3200. A breach of the 1.3200 zone would significantly increase the probability of a more profound market correction.
- Momentum Indicators: Both the Moving Average Convergence Divergence (MACD) and the Relative Strength Index (RSI) are signalling upward movement, suggesting that the bullish momentum could remain the prevailing force (in the short-term).
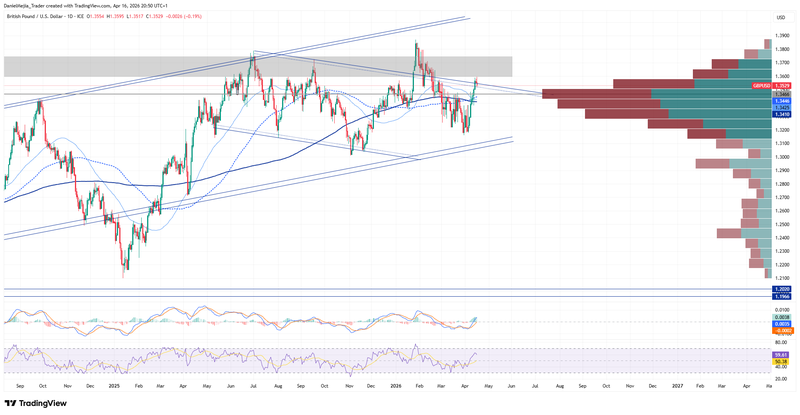
Figure 2. GBP/USD pair (2024–2026). Source: Data from the Intercontinental Exchange (ICE); own analysis conducted via TradingView.


