Gold prices waver as fragile US-Iran talks and Trump-Xi meeting fuel uncertainty
Gold prices are currently entering a phase of consolidation as market participants weigh the implications of fragile US–Iran negotiations against the upcoming high-stakes summit between Presidents Trump and Xi. Despite a resilient long-term bullish outlook, short-term volatility persists in the bullion.

Upcoming Trump-Xi meeting in Beijing aims to address energy security, Iranian sanctions, and fragile ceasefire negotiations affecting global markets.
Trump’s rejection of Iran’s peace response has spiked energy prices, renewing inflation fears and pressuring the Fed toward restrictive policies.
Gold maintains its position above the 200-day Simple Moving Average (SMA), underscoring a robust long-term uptrend; however, short-term price action is characterised by lower highs, signalling heightened market indecision.
Gold prices waver amid fragile US–Iran talks ahead of Trump–Xi meeting
Gold prices are currently trading within a consolidative structure, reflecting an absence of a definitive directional bias in the short-term. This sideways movement occurs amidst a backdrop of heightened global geopolitical instability. On one hand, the prospects for a durable peace agreement between the United States and Iran appear increasingly tenuous; on the other, the market is bracing for a pivotal meeting this week between US President Donald Trump and Chinese President Xi Jinping.
Market focus has shifted decisively toward the Trump–Xi summit, scheduled for 14–15 May in Beijing. As reported by Reuters, the diplomatic agenda is expected to encompass US–Iran ceasefire negotiations, global energy security, and the status of US sanctions regarding Iranian petroleum exports. Given that China remains a primary importer of Iranian oil, a cessation of hostilities and the subsequent normalisation of global energy supply chains would be highly advantageous for Beijing’s long-term economic stability.
Simultaneously, geopolitical volatility remains a primary market driver. President Trump recently dismissed Iran’s response to a US peace proposal, categorising the terms as unacceptable. This development prompted a unified rally across energy commodities, reigniting fears regarding global inflationary risks.
Gold prices rose marginally during the session, with the metal testing the confluence of the 50- and 100-day Simple Moving Averages (SMAs) as a key resistance level. The bullion remains caught between sustained safe-haven demand from central banks and investors, and mounting expectations of a restrictive Federal Reserve policy, which continues to exert downward pressure on prices.
Technical analysis of Gold
From a technical perspective, gold futures maintain a robust long-term bullish trajectory. A detailed analysis of the current market structure reveals several key observations:
- Trend Context: Over the long term, gold exhibits a transparent market structure defined by a sequence of "higher highs" and "higher lows". The price continues to respect the 200-day Simple Moving Average (SMA), confirming the underlying strength of the prevailing trend. However, over recent months, the short-term price action has shifted, exhibiting a structure of lower highs that indicates a temporary loss of momentum.
- Resistance Levels: Should the immediate short-term resistance at $4,900 be breached, the next significant technical ceiling is identified at the record high of $5,350. A sustained move above this threshold would signal a potential extension into uncharted price territory.
- Support Levels: In the event of a further price contraction, immediate short-term support is identified at $4,550. If this level is invalidated, the next structural floor is located at $4,300. This zone is of particular technical importance as it converges with the 200-day SMA and the support line of a long-term ascending trend channel. A breach of the $4,300 level would notably increase the probability of a deeper market correction.
- Momentum and Volume: Both the Moving Average Convergence Divergence (MACD) and the Relative Strength Index (RSI) are currently situated in neutral territory, suggesting a lack of predominant directional momentum in the immediate term.
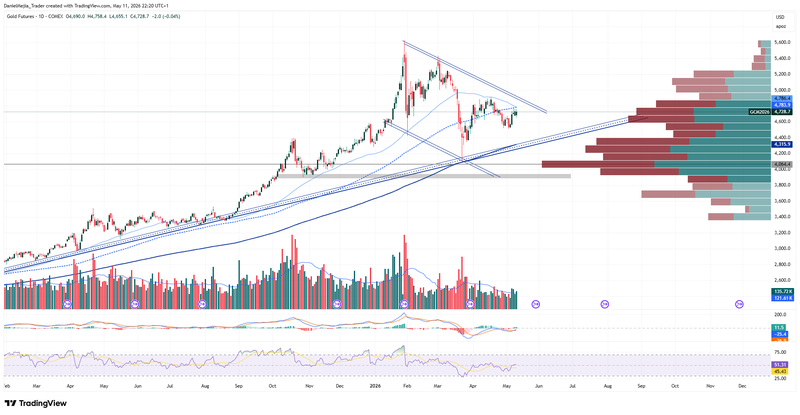
Figure 1. Gold Futures Contract (2025–2026). Source: Data from the COMEX Exchange; own analysis conducted via TradingView.


