Different chart types in forex trading
Learn about chart types used in currency trading and how to choose the best option for your trades.

Line charts are considered the simplest form of the charts and they offer a straightforward representation of price trends over time
Bar charts provide detailed information on price highs, lows, openings, and closings, offering more data than line charts
Candlestick charts are favoured for their visual clarity and detailed price information
Each chart type caters to different trading needs and strategies
Forex chart types
Forex trading relies heavily on the use of charts to track and predict trading product movements. Understanding the different types of charts is crucial for traders to analyse trends, make informed decisions, and develop effective trading strategies.
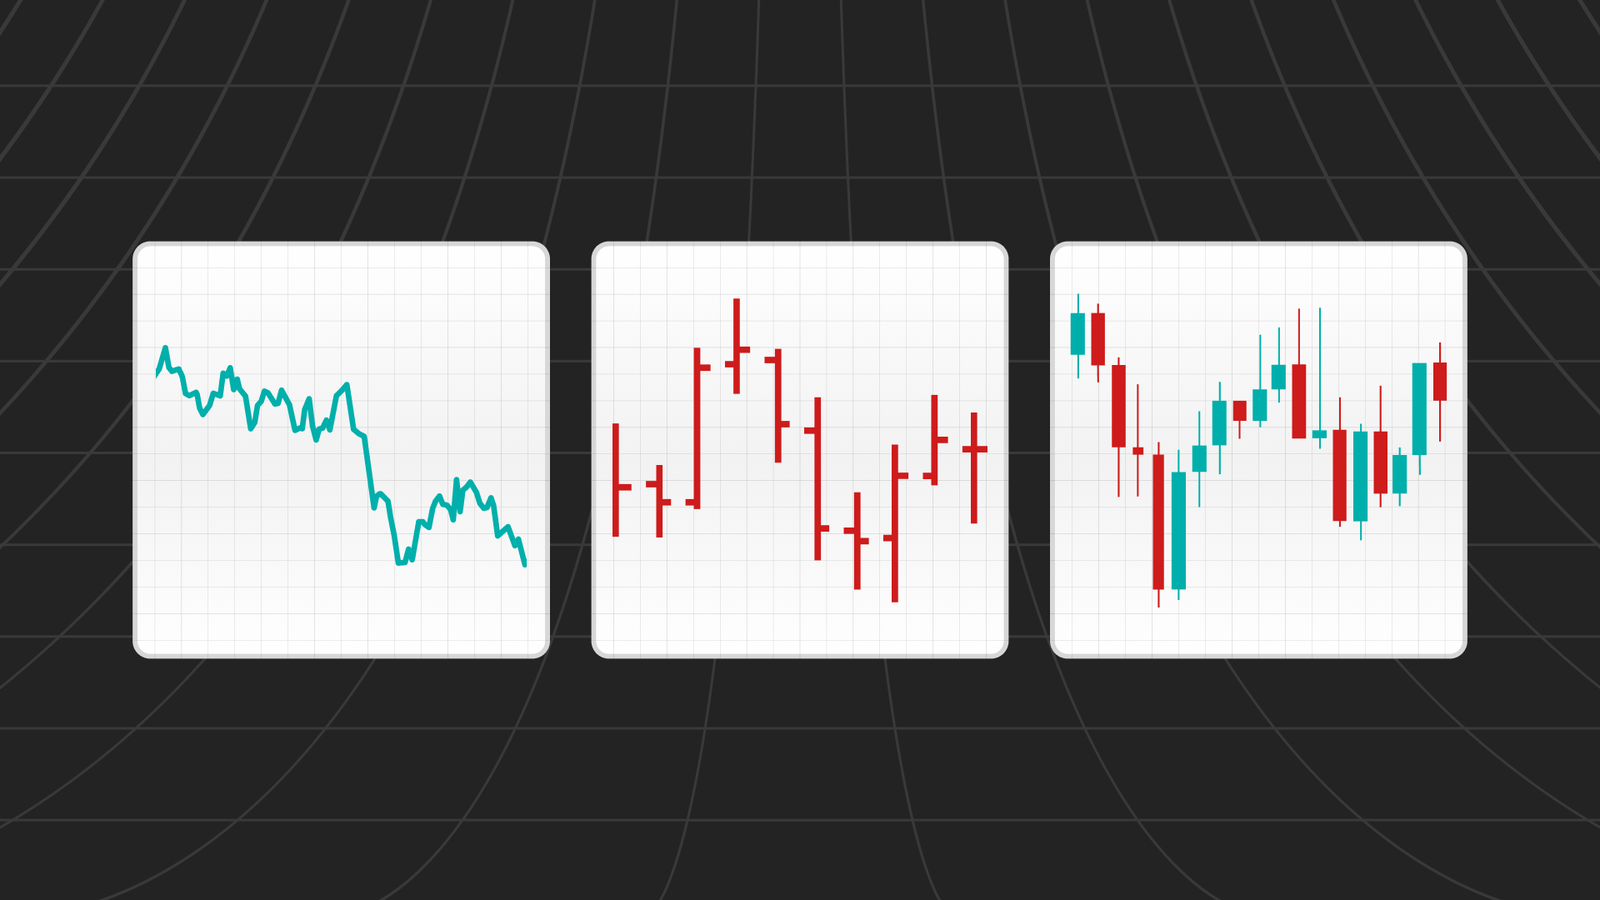
In forex trading, several chart types are utilised, each providing unique insights into market behaviour. The three most popular types of price charts are line chart, bar chart and candlestick chart.
Here's an overview of the most used chart types:
- Line charts
Line charts are the simplest form of forex charts. They are created by connecting a series of closing prices over a specified period. This type of chart provides a clear and straightforward view of the general price movement of a currency pair over time. Line charts are particularly useful for identifying broader trends but may not offer detailed information about price behaviour within the timeframe.
- Bar charts (HLOC)
Bar charts, also known as "High, Low, Open, Close" or HLOC charts, offer more information compared to line charts. Each bar represents a single period, such as a day, hour, or minute, and shows the opening price, closing price, as well as the high and low prices during that period. The top of the bar indicates the highest traded price, while the bottom signifies the lowest. The bar also has a small horizontal line on the left (opening price) and one on the right (closing price).
- Candlestick charts
Candlestick charts are among the most popular chart types used in forex trading due to their visual appeal and the amount of information they provide. Each 'candle' in a candlestick chart shows the opening, closing, high, and low prices for the given period. The main body (the wider section) of a candlestick shows the opening and closing prices, while the lines (or "wicks") above and below represent the high and low ones. Candlesticks are colour-coded to indicate an upward or downward trend.
Benefits of different chart types
The choice of chart type depends on the trader's style, strategy, and goals. While line charts offer simplicity, bar and candlestick charts provide more detailed information which can be critical for certain trading strategies.
Understanding each chart type and how to interpret them is fundamental to successful forex trading. Here are the main benefits of each chart type:
Line charts are ideal for beginners who are just getting to know the products and market. They are also useful for identifying long-term price trends.
Bar charts are useful in understanding the volatility and price movement within each trading period.
Candlestick charts are best for identifying potential reversals, continuation patterns, and market sentiment. Candlestick charts are also often favoured by traders for their visual representation of information.
Traders can also use several chart types to gain a more comprehensive understanding of the market and recent price movements.


