Support
Trading Ideas
Get the edge with potential investments and opportunities
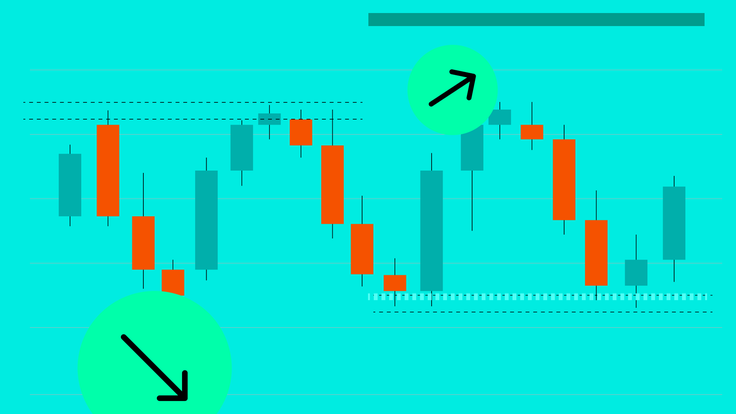
How to spot trend changes with the Aroon indicator
The Aroon indicator is designed to help traders assess trend direction and possible turning points. This article explains how its 0% to 100% scale and crossover signals can support market analysis.
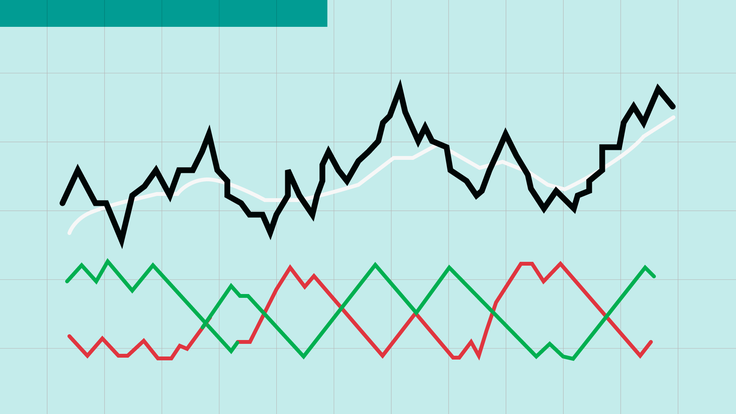
How inflation influences stocks and investor sentiment
Higher inflation can affect stocks by reducing purchasing power, increasing business costs and changing interest-rate expectations. This article explains how these pressures feed into profits and valuations.

What is the Wyckoff accumulation pattern?
The Wyckoff Accumulation Model is used to analyse how demand can build before a stronger move higher. This article explains the phases of the model and how traders use them to assess market structure.

How internal and external structure work in ICT
In ICT trading, internal and external structure help traders understand short-term movement and the wider price target. This article shows how they support BOS, FVG and Order Block analysis.
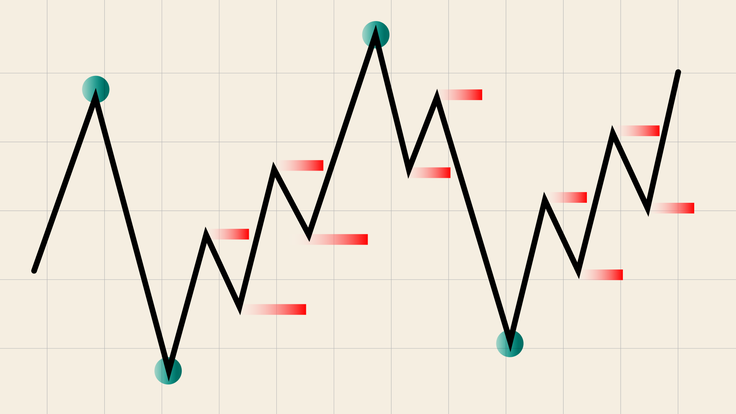
YoY explained: how to calculate and analyse year-over-year change
Year-over-year (YoY) shows whether a figure has risen or fallen compared with the equivalent period in the previous year. The measure is frequently used in earnings reports and economic releases to track changes in areas such as company performance, inflation and economic growth.
9 Sep 2026, 11:47
Trading before and after market hours: how it works
Extended-hours trading gives you access to selected stocks and ETFs before and after the regular market session. When you can trade, which assets are available and the conditions you trade in depend on your broker or platform.
9 Sep 2026, 11:01
Reading correlated markets with SMT Divergence
SMT Divergence focuses on the relationship between two markets that normally move in a similar way. This article shows how ICT traders use a break in that relationship to identify liquidity and possible reversal setups.
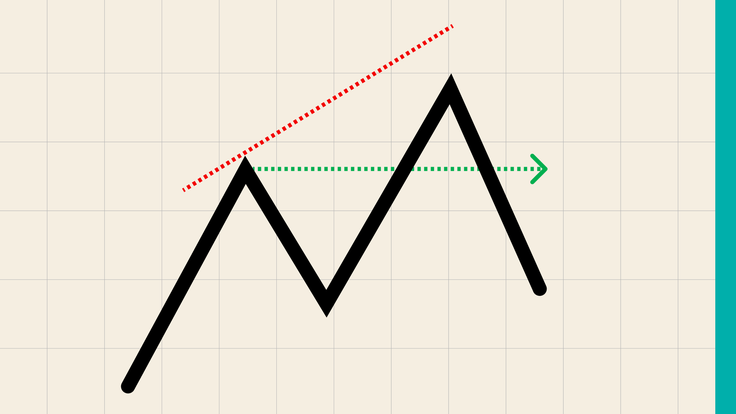
A trader’s guide to the VIX fear index
The VIX uses S&P 500 options and CBOE’s model-free methodology to estimate expected market volatility over the next 30 days. This article shows how the index is calculated and what it can reveal about sentiment.

How the ICT Unicorn model works
In Smart Money Concepts (SMC), the ICT Unicorn Strategy is built around the overlap between a Breaker Block (BB) and a Fair Value Gap (FVG). This article explains how confirmation through displacement can help traders identify a potential entry zone.
A guide to equal highs and equal lows in SMC trading
Equal highs and equal lows are important in Smart Money Concepts (SMC) because they can reveal where market liquidity is concentrated. This article shows how traders interpret these levels and why they often matter before a move.